PROTECTED SOURCE SCRIPT
Mis à jour Financial Label
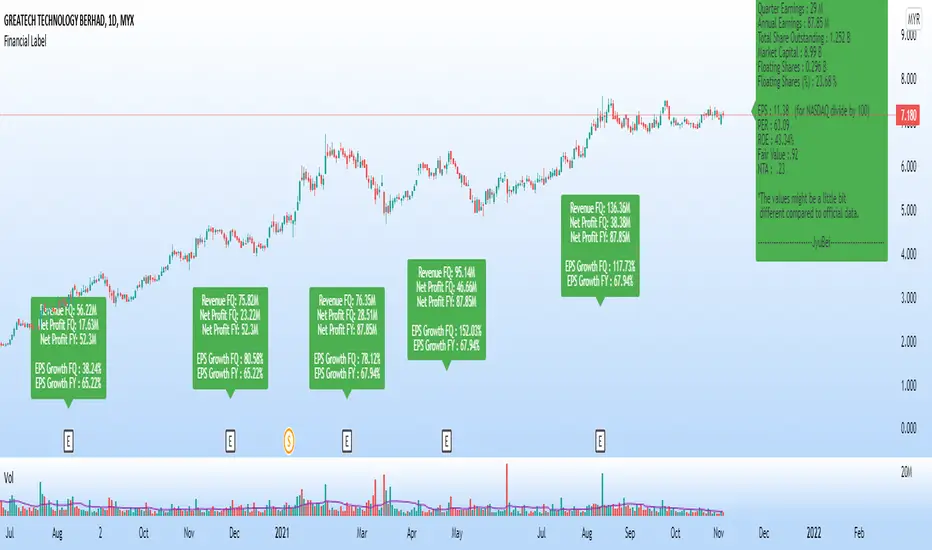
5 Magic Numbers, C, A & S (for CANSLIM) in 1 label.
This label shows:
1. Latest Quarter Earnings (QR)
2. Annual Earnings (AR)
3. Total Share Outstanding
4. Market Capital
5. Floating Shares
6. Earning per Share (EPS)
7. Price per Earning Ratio (P/E Ratio @ PER)
8. Return On Equity (ROE)
9. Fair Value (FV)
10. Non Tangible Asset (NTA)
This label will show the data only on charts that have financial data only.
Warrants, futures, crypto, etc. will not have any display on this label.
Suitable for all markets including US, Asia, Europe and others.
Thus, no currency symbol ($,¥,€, RM, etc.) will be displayed, only numbers.
Green label means EPS is positive - profitable company.
Red label means EPS is negative - loss making company.
Note:
1. The values might be a little bit different from official data, due to type of data taken & calculations, as we have a few formulas for each data.
2. Please confirm more accurate data from your trusted and official source of data.
Notes de version
Additional1. Floating share in percent (%)
2. Quarter Report (QR/FQ) data
i. Revenue FQ
ii. Net profit FQ
iii. Net profit FY
iv. EPS Growth FQ
v. EPS Growth FY
* If Net Profit is POSITIVE, the label will be in GREEN.
** If Net Profit is NEGATIVE, the label will be in RED.
Changes:
1. Earnings are in Million (M)
2. Shares are in Billion (B)
Note:
1. For US market, the EPS value need to divide by 100. This number is close to the values in finvis.com (my reference)
2. The values might be different from other source of data. Please use as quick reference, not main reference.
Script protégé
Ce script est publié en source fermée. Cependant, vous pouvez l'utiliser librement et sans aucune restriction – pour en savoir plus, cliquez ici.
Clause de non-responsabilité
Les informations et publications ne sont pas destinées à être, et ne constituent pas, des conseils ou recommandations financiers, d'investissement, de trading ou autres fournis ou approuvés par TradingView. Pour en savoir plus, consultez les Conditions d'utilisation.