OPEN-SOURCE SCRIPT
Mis à jour Parabolic SAR with alerts
This is Parabolic SAR with alerts built-in.
Notes de version
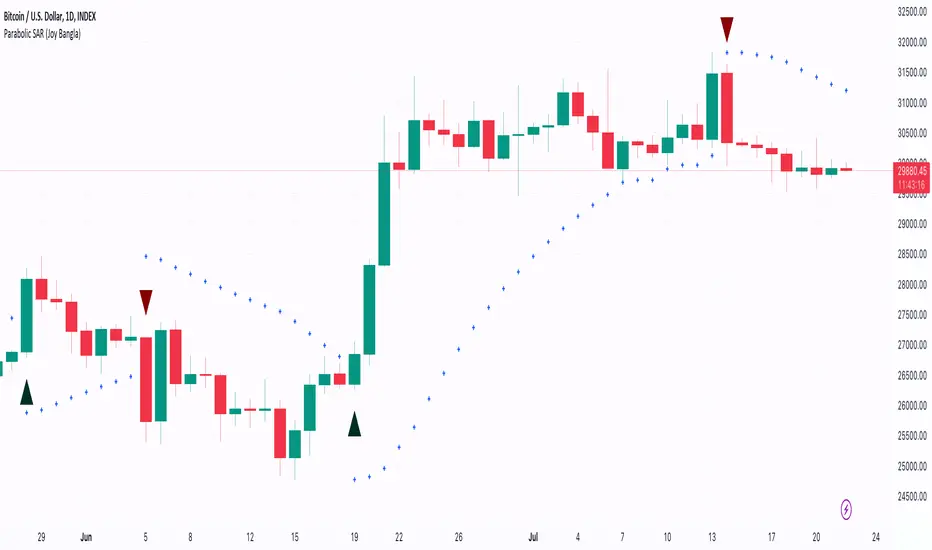
This script is a custom implementation of the Parabolic SAR (Stop and Reverse) technical indicator, designed to provide potential 'buy' and 'sell' signals.
It first calculates the Parabolic SAR using a start value of 0.02, an increment of 0.02, and a maximum value of 0.2. The resulting Parabolic SAR values are then plotted with blue cross-style markers on the chart.
The script identifies bullish and bearish signals based on the relationship between the Parabolic SAR and the high and low prices:
- Bullish Signal: If the Parabolic SAR is below the current high and above the previous low, a green triangle pointing upward is plotted below the bar. This is seen as a potential 'buy' signal, and an alert titled 'Buy SAR' is set to trigger at this condition.
- Bearish Signal: If the Parabolic SAR is above the current low and below the previous high, a red triangle pointing downward is plotted above the bar. This is seen as a potential 'sell' signal, and an alert titled 'Sell SAR' is set to trigger at this condition.
This custom Parabolic SAR indicator offers a visual and alert-based method for identifying potential trading signals, making it a helpful tool for traders seeking to use it in their trading strategy.
Please note that, like all technical analysis tools, this indicator should be used in conjunction with other forms of analysis and is not meant to provide buy or sell signals.
Always conduct your own analysis and consult a financial advisor before trading.
Script open-source
Dans l'esprit TradingView, le créateur de ce script l'a rendu open source afin que les traders puissent examiner et vérifier ses fonctionnalités. Bravo à l'auteur! Bien que vous puissiez l'utiliser gratuitement, n'oubliez pas que la republication du code est soumise à nos Règles.
For guides on how to use the Aladdin indicator or how to buy it, please check joy-bangla.gitbook.io/aladdin/
Clause de non-responsabilité
Les informations et publications ne sont pas destinées à être, et ne constituent pas, des conseils ou recommandations financiers, d'investissement, de trading ou autres fournis ou approuvés par TradingView. Pour en savoir plus, consultez les Conditions d'utilisation.