PROTECTED SOURCE SCRIPT
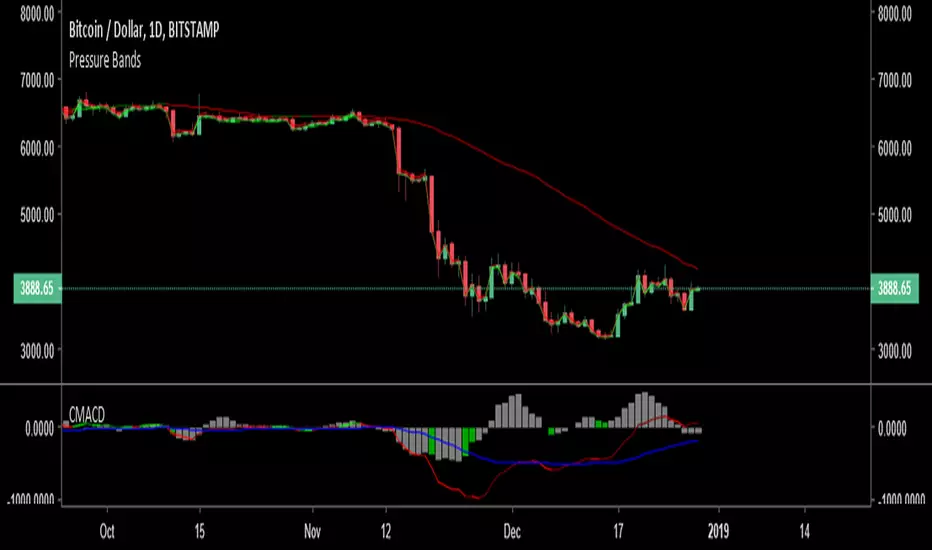
Custom MACD

Multi indication MACD , the macd coloring indicates when the trend is aligned with the indicator direction , the macd signal line measure's market sentiment blue for bearish yellow for bullish , the histogram works off rate of change rather then the cross over and color of the histogram indicates possible bull or bear reversal of trend
Script protégé
Ce script est publié en source fermée. Cependant, vous pouvez l'utiliser librement et sans aucune restriction – pour en savoir plus, cliquez ici.
Clause de non-responsabilité
Les informations et publications ne sont pas destinées à être, et ne constituent pas, des conseils ou recommandations financiers, d'investissement, de trading ou autres fournis ou approuvés par TradingView. Pour en savoir plus, consultez les Conditions d'utilisation.