PROTECTED SOURCE SCRIPT
Valdex HARSI
English Description: VALDEX-H (Standalone)
Title: VALDEX-H (Valdex Heikin-Ashi RSI)
Overview
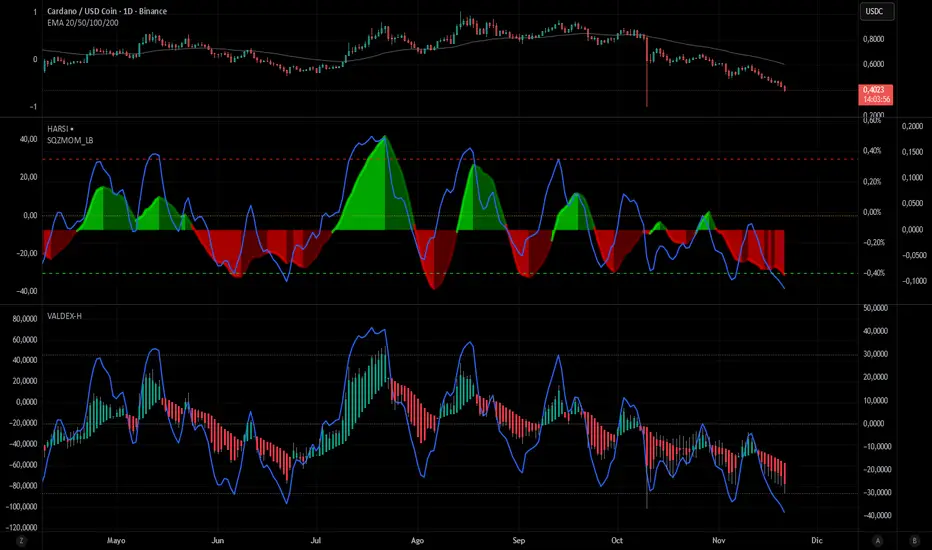
The VALDEX-H is an advanced momentum oscillator designed to provide a cleaner and less noisy view of market momentum compared to a standard Relative Strength Index (RSI). It integrates Heikin-Ashi smoothing logic directly into the RSI calculation, effectively filtering market fluctuations and providing clearer trend visualization, optimized for Pine Script v6.
Key Components and Signals
Custom Candle Plot: The core of VALDEX-H is a series of candles plotted within the indicator panel, generated from the smoothed RSI data itself.
Green/Teal Candles: Indicate strong or rising bullish momentum.
Red/Maroon Candles: Indicate strong or rising bearish momentum.
The consistency of the candle color is the primary trend signal.
RSI Overlay Line: A smoothed line that plots the overall trajectory of the VALDEX-H signal, useful for identifying divergences and general momentum flow.
Fixed Reference Levels: The indicator uses fixed, non-editable levels for standardized overbought and oversold analysis:
Overbought (OB): +30
Oversold (OS): -30
Zero Line (0): Acts as the median, signaling the shift between bullish and bearish control.
How to Use
The VALDEX-H excels at identifying low-risk entry points and trend shifts:
Trend Confirmation: Use the candle color to confirm the market's trend direction. A shift from Red to Green/Teal suggests a potential bottom or reversal.
Overbought/Oversold Reversals: Look for the RSI Overlay Line to touch or cross the +30 or -30 levels, followed by a change in candle color for high-probability reversal signals.
Cross Zero Signal: A strong signal occurs when the RSI Overlay Line crosses the zero line, confirming the shift from bearish control (below 0) to bullish control (above 0), or vice-versa.
Script protégé
Ce script est publié en source fermée. Cependant, vous pouvez l'utiliser librement et sans aucune restriction – pour en savoir plus, cliquez ici.
Clause de non-responsabilité
Les informations et publications ne sont pas destinées à être, et ne constituent pas, des conseils ou recommandations financiers, d'investissement, de trading ou autres fournis ou approuvés par TradingView. Pour en savoir plus, consultez les Conditions d'utilisation.