OPEN-SOURCE SCRIPT
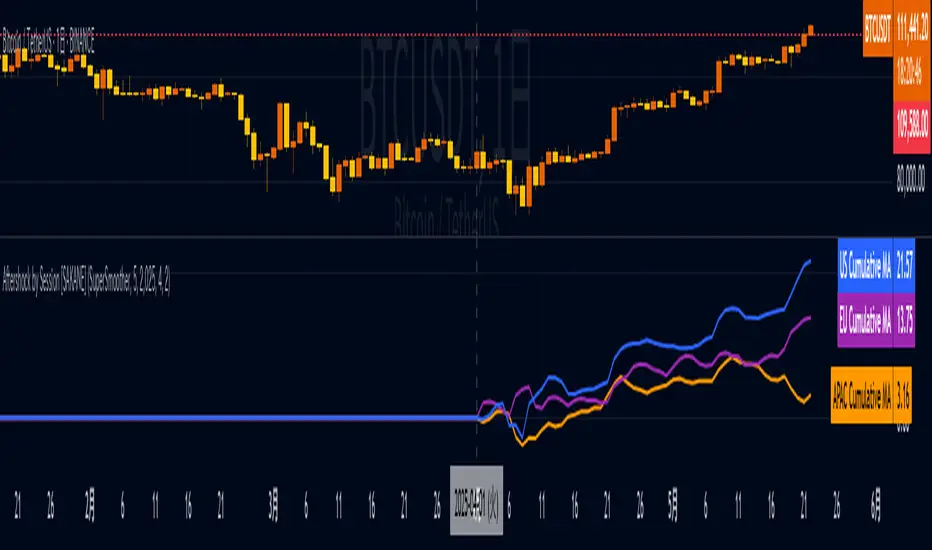
Aftershock by Session [SAKANE]
■ Background & Motivation
In 24/7 markets like crypto, not all participants react simultaneously to major events.
Instead, reactions unfold across different regional trading sessions — Asia (APAC), Europe (EU), and the United States (US) — each with its own tempo and sentiment.
This indicator is designed to visualize which session drives the market after a key event — capturing the "aftershock" effect that ripples through time zones.
■ Key Features
Tracks price return (open → close) for each session: APAC / EU / US
Cumulative session returns are calculated and visualized
Smoothing options: SMA, EMA, or Ehlers SuperSmoother
Optimized for daily charts to highlight structural momentum shifts
Toggle visibility of each session independently
■ Why “Aftershock”?
Take April 2, 2025 — the day of the “Trump Tariff Opening.”
That policy announcement triggered a market-wide response. But:
Which session reacted first?
Which session truly moved the market?
This indicator is named “Aftershock” because it helps you see the ripple effect of such events — when and where momentum followed.
■ How to Use
Search for “Aftershock by Session [SAKANE]” on TradingView
Add it to your chart (use Daily timeframe)
Customize sessions and smoothing options via settings
You can also bookmark it for quick access.
■ Insights & Use Cases
Detect which session initiated or led market moves after news events
Understand geo-temporal dynamics — did the move start in Asia, Europe, or the US?
For example, on April 2, 2025, the day Trump’s tariff pivot was announced:
You can instantly see which session took the lead —
the APAC session hesitated, while the US session drove the trend.
This insight becomes visually obvious with the cumulative lines.
■ Unique Value
Unlike typical indicators based on raw price action,
Aftershock analyzes market movement through a session-based structural lens.
It captures where capital actually moved — and when.
A tool not just for technical analysis, but for event-driven, macro-aware market reading.
■ Final Thoughts
To truly understand market mechanics, we must look beyond candles and trends.
Aftershock by Session [SAKANE] breaks down the 24-hour cycle into meaningful regional flows,
allowing you to track the true drivers behind price momentum.
Whether you're trading, researching, or tracking macro catalysts,
this tool helps answer the key question:
“Who moved the market — and when?”
Script open-source
Dans l'esprit TradingView, le créateur de ce script l'a rendu open source afin que les traders puissent examiner et vérifier ses fonctionnalités. Bravo à l'auteur! Bien que vous puissiez l'utiliser gratuitement, n'oubliez pas que la republication du code est soumise à nos Règles.
Clause de non-responsabilité
Les informations et publications ne sont pas destinées à être, et ne constituent pas, des conseils ou recommandations financiers, d'investissement, de trading ou autres fournis ou approuvés par TradingView. Pour en savoir plus, consultez les Conditions d'utilisation.