PROTECTED SOURCE SCRIPT
Mis à jour Fibonacci VIP
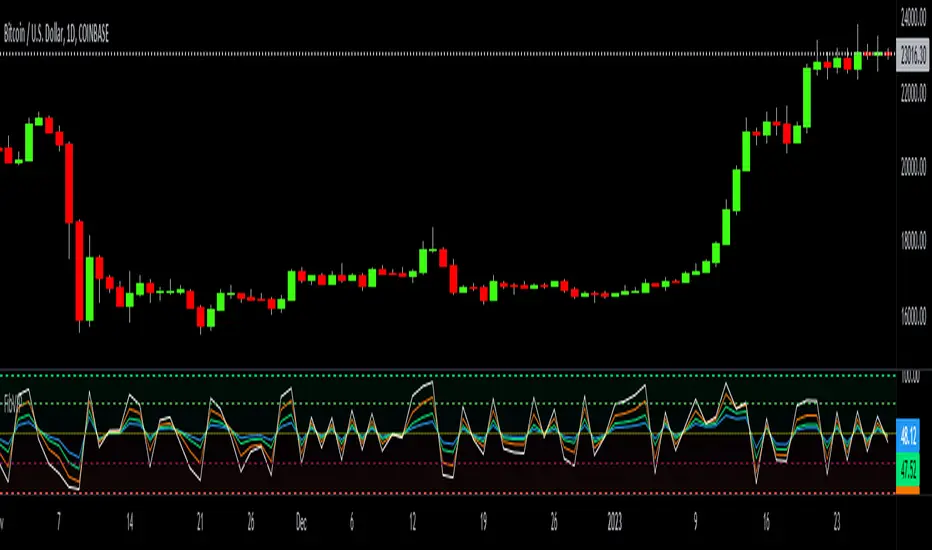
Fibonacci VIP (Fibonacci Volume Indicator Precision) is a volume indicator that I made to help me have precise entry and exit timing. It's based on the well known Fibonacci sequence 8, 13, 21, 34, 55, 89...
The default colors I like to use can be changed to whatever you want. The numbers inputted are based on volume EMA .
Bullish momentum in ascending order is 21 = white, 13 = blue, 8 = green. Bearish momentum descending order is 89 = red, 55 = yellow, 34 = purple. Also, there's a zero gray dotted line and high / low dashed channel line, to help keep momentum in perspective.
The most bullish signal is when all colors are in a top down order green, blue, white, purple, yellow, red. The most bearish signal is when all colors are reversed and have a bottom up order of green, blue, white, purple, yellow, red.
Also, a crossover, cross-under, divergence or convergence of these colors, help signal the future price action. For example, green crossing over red is bullish , green crossing under red is bearish .
If colors are low / below the zero line that's bearish and if they are above the zero line, that's bullish.
The Fibonacci VIP works great with the ADL indicator as a second redundant confirmation of the underlying securities momentum.
Good luck and happy trading friends...
Notes de version
*updated1) added a 7th fastest ema 5 volume
2) made default base ema 89 line thicker
Notes de version
ema5 volume histogramNotes de version
ema 89 v default line thicknessema 5 v default histogram color
Notes de version
Default line colorsNotes de version
input tweak = ohlc4Notes de version
added +2 hlines with default colorNotes de version
Update to indicator version5Feature upgrades
add track value
add Fibonacci 144 & 233
Notes de version
add 2x track valueNotes de version
1/28/2023 FibVIP 2.0 updateconvert volume sma into volume rsi
add a tracking line option to all inputs
change default display to 2, 3, 5, 8 inputs
Notes de version
header updateScript protégé
Ce script est publié en source fermée. Cependant, vous pouvez l'utiliser librement et sans aucune restriction – pour en savoir plus, cliquez ici.
Trading indicators:
tradingview.com/u/Options360/
tradingview.com/u/Options360/
Clause de non-responsabilité
Les informations et publications ne sont pas destinées à être, et ne constituent pas, des conseils ou recommandations financiers, d'investissement, de trading ou autres fournis ou approuvés par TradingView. Pour en savoir plus, consultez les Conditions d'utilisation.
Script protégé
Ce script est publié en source fermée. Cependant, vous pouvez l'utiliser librement et sans aucune restriction – pour en savoir plus, cliquez ici.
Trading indicators:
tradingview.com/u/Options360/
tradingview.com/u/Options360/
Clause de non-responsabilité
Les informations et publications ne sont pas destinées à être, et ne constituent pas, des conseils ou recommandations financiers, d'investissement, de trading ou autres fournis ou approuvés par TradingView. Pour en savoir plus, consultez les Conditions d'utilisation.