OPEN-SOURCE SCRIPT
Mis à jour [NLR] - SweetSpot Zones
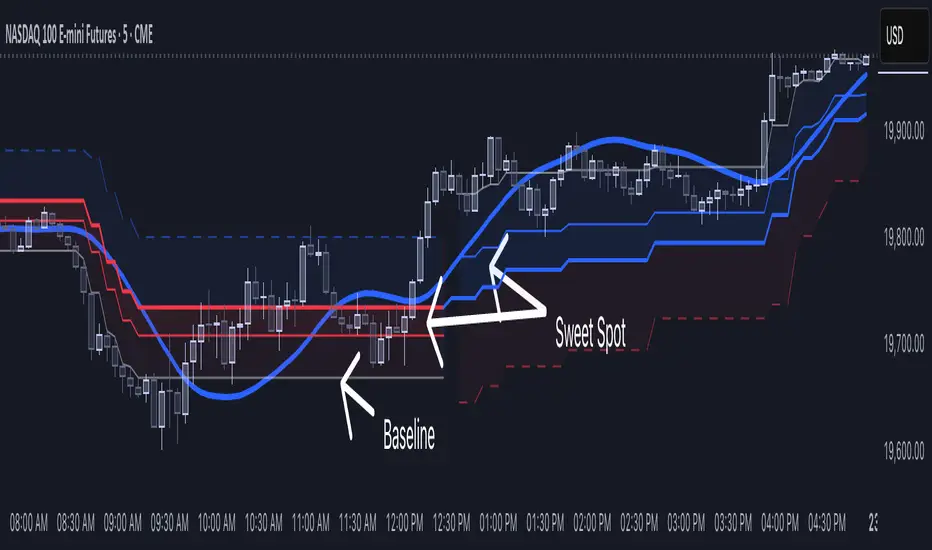
The Sweet Spot Zone helps you find the best spots to enter a trade, inspired by the "Follow Line Indicator" by Dreadblitz (big thanks to him!). It draws a colored zone on your chart to show ideal entry points, with a Base Point to keep you on track.
What It Does
How to Use It
Settings
Credits
Inspired by the "Follow Line Indicator" by Dreadblitz—check out his work for more great ideas!
What It Does
- Blue Zone: Uptrend—buy when the price dips into the zone.
- Red Zone: Downtrend—sell or short when the price climbs into the zone.
- Base Point: A gray line showing the key level the zone is built on.
How to Use It
- Look for the colored zone:
- Blue: Buy if the price dips into the zone but stays above the Base Point.
- Red: Sell/short if the price climbs into the zone but stays below the Base Point. - Important: Avoid entering trade beyond base point - you might see low returns and face big drawdowns.
- Confirm with other signals (like RSI/MACD) before entering.
Settings
- ATR Length (10): How far back it looks to calculate price movement.
- ATR Multiplier (2.5): How wide the zone is.
- Error Margin (5.0): Keeps the zone steady during small price wiggles.
- Uptrend/Downtrend Colors: Change the zone colors if you’d like!
Credits
Inspired by the "Follow Line Indicator" by Dreadblitz—check out his work for more great ideas!
Notes de version
Added other side zone to show possible area where price action may goScript open-source
Dans l'esprit TradingView, le créateur de ce script l'a rendu open source afin que les traders puissent examiner et vérifier ses fonctionnalités. Bravo à l'auteur! Bien que vous puissiez l'utiliser gratuitement, n'oubliez pas que la republication du code est soumise à nos Règles.
Clause de non-responsabilité
Les informations et publications ne sont pas destinées à être, et ne constituent pas, des conseils ou recommandations financiers, d'investissement, de trading ou autres fournis ou approuvés par TradingView. Pour en savoir plus, consultez les Conditions d'utilisation.
Script open-source
Dans l'esprit TradingView, le créateur de ce script l'a rendu open source afin que les traders puissent examiner et vérifier ses fonctionnalités. Bravo à l'auteur! Bien que vous puissiez l'utiliser gratuitement, n'oubliez pas que la republication du code est soumise à nos Règles.
Clause de non-responsabilité
Les informations et publications ne sont pas destinées à être, et ne constituent pas, des conseils ou recommandations financiers, d'investissement, de trading ou autres fournis ou approuvés par TradingView. Pour en savoir plus, consultez les Conditions d'utilisation.