OPEN-SOURCE SCRIPT
Multiple Moving Averages with Offset
User Description:
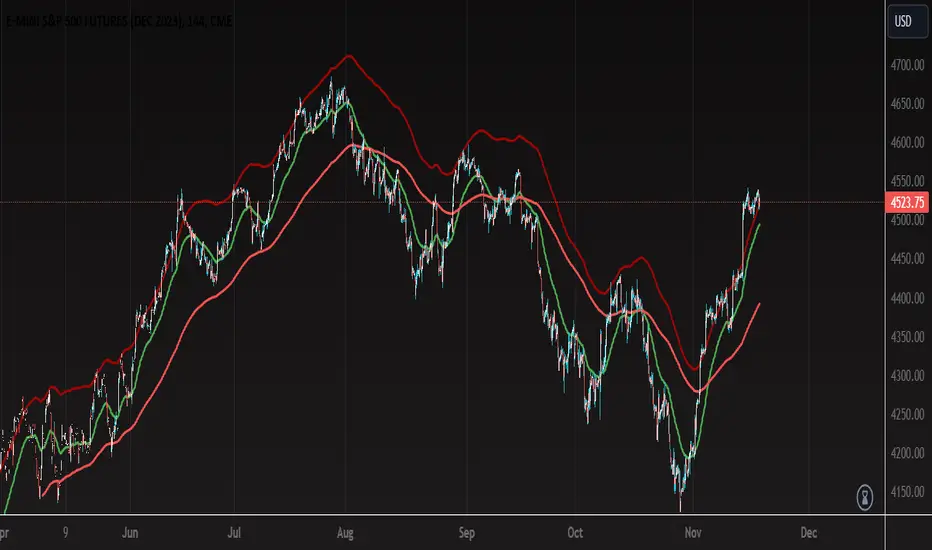
This indicator is designed to provide insights into market trends based on multiple moving averages with customizable offsets. It combines short-term and long-term moving averages to offer a comprehensive view of price movements. The user can adjust various parameters to tailor the indicator to their preferred settings.
How the Strategy Works:
Short-Term Fast Moving Average:
Length: 47 (Adjustable by the user)
Offset: Adjustable (User-defined)
Color: Green
Line Thickness: 2 (Thicker green line for better visibility)
Long-Term Fast Moving Average:
Length: 203 (Adjustable by the user)
Offset: Adjustable (User-defined)
Color: Red
Line Thickness: 2 (Thicker red line for better visibility)
Long-Term Slow Moving Average:
Length: 100 (Adjustable by the user)
Offset: 77 (Adjustable by the user)
Color: Custom Red (RGB: 161, 5, 5)
Line Thickness: 2 (Thicker red line for better visibility)
Interpretation:
When the Short-Term Fast Moving Average (green line) is above the Long-Term Fast Moving Average (red line), it may signal a potential uptrend.
Conversely, when the Short-Term Fast Moving Average is below the Long-Term Fast Moving Average, it may indicate a potential downtrend.
The Long-Term Slow Moving Average provides additional context, allowing users to assess the strength and stability of trends.
Customization:
Users can experiment with different lengths and offsets to fine-tune the indicator based on their trading preferences and market conditions.
TIPS:
- When price action reaches upper RED moving average is probable that the price action is close to a pull back or change of direction.
- When price action falls and closes below the bottom RED moving average it can be a possible change of direction to the downside.
- You can use the green moving average as a filter and confluence to identify if the price action is moving towards the upside or downside.
Note: This indicator is for informational purposes only and should be used in conjunction with other analysis tools for comprehensive decision-making.
Script open-source
Dans l'esprit TradingView, le créateur de ce script l'a rendu open source afin que les traders puissent examiner et vérifier ses fonctionnalités. Bravo à l'auteur! Bien que vous puissiez l'utiliser gratuitement, n'oubliez pas que la republication du code est soumise à nos Règles.
Contact me for a free market analysis!!
Clause de non-responsabilité
Les informations et publications ne sont pas destinées à être, et ne constituent pas, des conseils ou recommandations financiers, d'investissement, de trading ou autres fournis ou approuvés par TradingView. Pour en savoir plus, consultez les Conditions d'utilisation.