OPEN-SOURCE SCRIPT
Trend 1
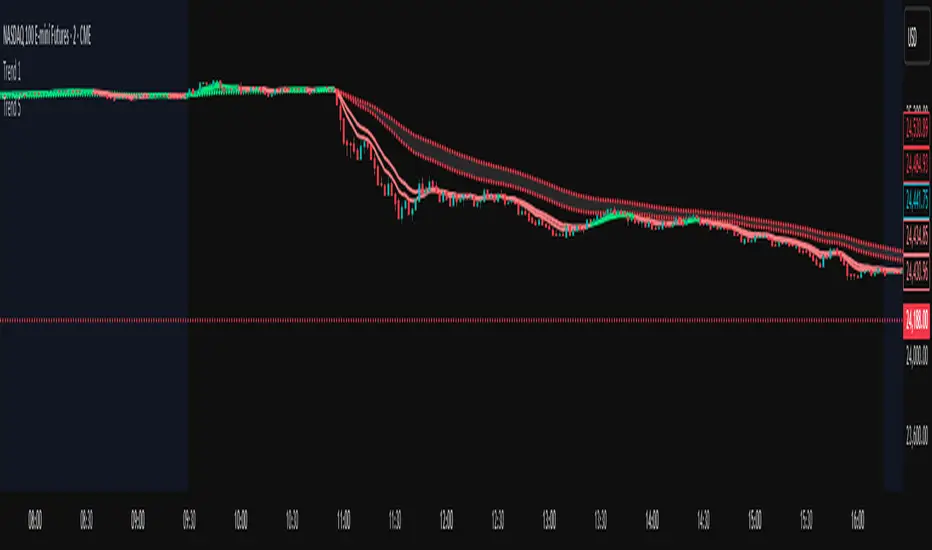
EMA Trend tracker.
This script plots two EMAs: a short-term EMA (line) and a long-term EMA (dots). The line color turns green when the short EMA is above the long EMA, and red when it’s below. Users can select a custom timeframe for the EMA calculation using the input settings. A shaded area is drawn between the two EMAs to visually represent the trend zone.
This script plots two EMAs: a short-term EMA (line) and a long-term EMA (dots). The line color turns green when the short EMA is above the long EMA, and red when it’s below. Users can select a custom timeframe for the EMA calculation using the input settings. A shaded area is drawn between the two EMAs to visually represent the trend zone.
Script open-source
Dans l'esprit TradingView, le créateur de ce script l'a rendu open source afin que les traders puissent examiner et vérifier ses fonctionnalités. Bravo à l'auteur! Bien que vous puissiez l'utiliser gratuitement, n'oubliez pas que la republication du code est soumise à nos Règles.
Clause de non-responsabilité
Les informations et publications ne sont pas destinées à être, et ne constituent pas, des conseils ou recommandations financiers, d'investissement, de trading ou autres fournis ou approuvés par TradingView. Pour en savoir plus, consultez les Conditions d'utilisation.