OPEN-SOURCE SCRIPT
Mis à jour Screener MA Cross

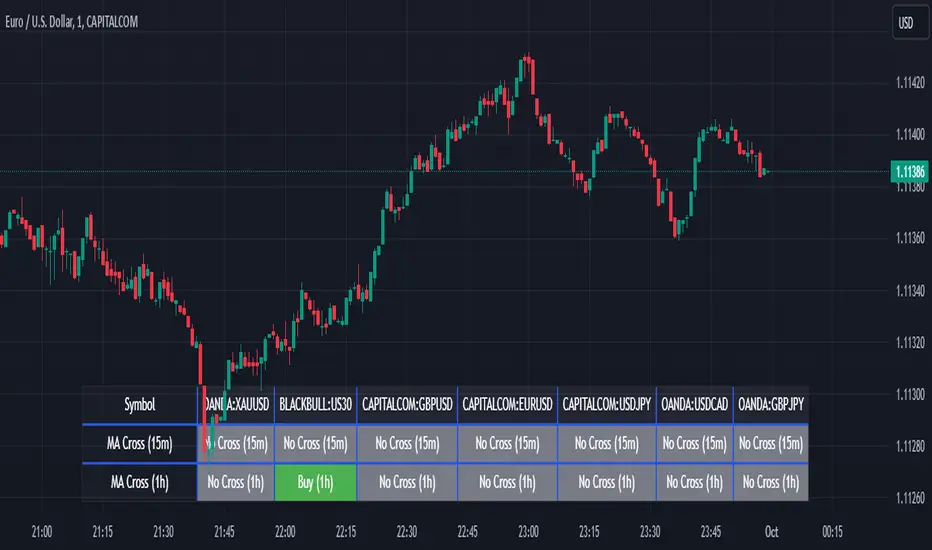
The Screener MA Cross is an efficient tool designed to help traders quickly identify potential buy and sell signals across multiple currency pairs and timeframes. This script monitors the crossover behavior of two moving averages (MA8 and MA50) to determine possible entry points for trades.
Key Features:
How It Works: The script uses moving averages (MA8 and MA50) to analyze crossover patterns, a common method for identifying trend changes. A crossover occurs when a shorter moving average (MA8) crosses above or below a longer moving average (MA50). By requesting data from the 15-minute and 1-hour timeframes, the Screener MA Cross provides a clear overview of the market situation across various assets, helping you decide on potential trades.
This tool is particularly useful for trend-following strategies and can be used to spot momentum shifts on smaller timeframes, making it ideal for day traders and scalpers.
How to Use:
Key Features:
- Multi-Pair Monitoring: The indicator allows users to screen popular assets, including XAUUSD, US30, GBPUSD, EURUSD, USDJPY, USDCAD, and GBPJPY. You can add or remove symbols based on your preference.
- Dual Timeframe Analysis: It tracks moving average crossovers on both 15-minute and 1-hour charts, giving users insights into short-term and medium-term trends without switching between timeframes.
- Color-Coded Signals:
- Green: Indicates a bullish "Buy" signal when the MA8 crosses above the MA50, suggesting upward momentum.
- Red: Indicates a bearish "Sell" signal when the MA8 crosses below the MA50, signaling downward momentum.
- Gray: Represents a neutral or no-cross state, indicating no clear trend.
- Clean Table Format: Displays all relevant signals directly on your chart in a structured, easy-to-read table format, allowing you to quickly scan and assess trading opportunities.
How It Works: The script uses moving averages (MA8 and MA50) to analyze crossover patterns, a common method for identifying trend changes. A crossover occurs when a shorter moving average (MA8) crosses above or below a longer moving average (MA50). By requesting data from the 15-minute and 1-hour timeframes, the Screener MA Cross provides a clear overview of the market situation across various assets, helping you decide on potential trades.
This tool is particularly useful for trend-following strategies and can be used to spot momentum shifts on smaller timeframes, making it ideal for day traders and scalpers.
How to Use:
- Add the indicator to your chart and customize the asset symbols to match your trading preferences.
- Monitor the signals on the table. Green signals indicate potential buying opportunities, while red signals suggest possible selling points.
- Use alongside other analysis: While the Screener MA Cross offers valuable insights, it's best used in combination with other indicators and analysis techniques to confirm trade setups.
Notes de version
This script, "Screener MA Cross," is designed to monitor and display MA (Moving Average) cross signals across multiple timeframes and symbols. With the latest update, it offers more flexibility, style, and usability. Here are the key features:
Features:
- Multi-Timeframe Analysis: Tracks MA crossovers on both 15-minute and 1-hour charts, allowing traders to spot short-term and medium-term opportunities across multiple pairs simultaneously.
- Custom Table Positioning: Choose from nine table positions, including "Top," "Middle," and "Bottom" variants, ensuring the screener fits your chart layout perfectly.
- Professional Table Design: The updated table header comes with a sleek, modern black background and enhanced color contrast to make key information stand out. The table is more readable and polished, perfect for a professional trading environment.
- User-Defined Font Size: Customize the font size ("tiny," "small," "normal," or "large") to match your display preferences, whether you're using a large monitor or a compact laptop screen.
- Symbol-Specific Monitoring: Easily select which symbols you want to include in the screener, such as XAUUSD, US30, GBPUSD, and more, so you can focus on what matters most to your trading strategy.
How to Use:
- Add the indicator to your TradingView chart.
- Customize the Moving Average lengths, table position, and font size according to your preferences.
- Select the symbols you want to monitor, and the screener will automatically display the MA cross signals for 15-minute and 1-hour intervals.
- Keep an eye on the table for "Buy" and "Sell" signals, color-coded for easy identification.
Who Is It For? Ideal for traders who monitor multiple symbols and timeframes simultaneously, this screener makes it easier to track market movements and identify opportunities based on Moving Average crossovers. Suitable for scalpers, day traders, and swing traders alike.
Script open-source
Dans l'esprit TradingView, le créateur de ce script l'a rendu open source afin que les traders puissent examiner et vérifier ses fonctionnalités. Bravo à l'auteur! Bien que vous puissiez l'utiliser gratuitement, n'oubliez pas que la republication du code est soumise à nos Règles.
Clause de non-responsabilité
Les informations et publications ne sont pas destinées à être, et ne constituent pas, des conseils ou recommandations financiers, d'investissement, de trading ou autres fournis ou approuvés par TradingView. Pour en savoir plus, consultez les Conditions d'utilisation.