OPEN-SOURCE SCRIPT
Candle Price Movement
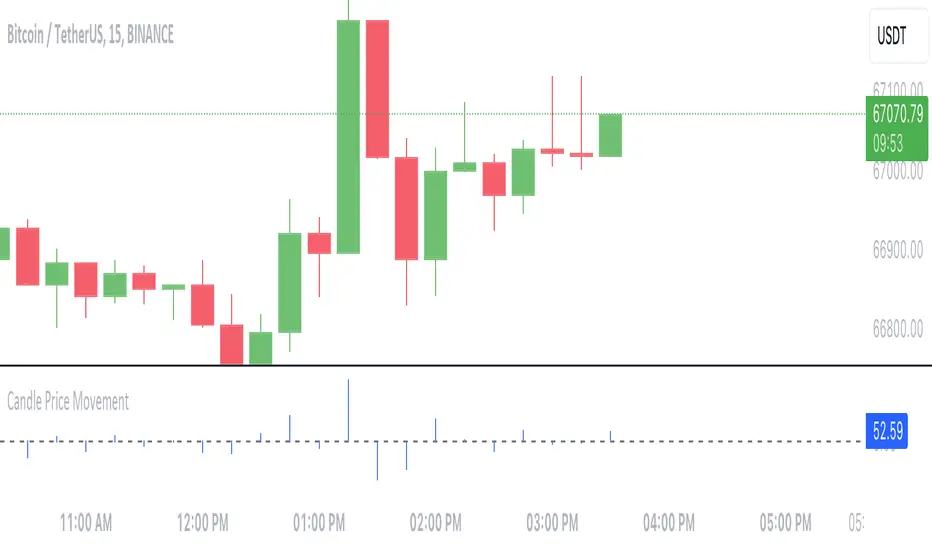
This Pine Script indicator calculates and visualizes the price movement for each candlestick on the chart.
- **Calculation**: The price movement for each candle is determined by subtracting the opening price from the closing price.
- **Visualization**: The price movement is plotted as a histogram, with positive values indicating upward movement (green bars) and negative values indicating downward movement (red bars).
- **Options**:
- The histogram bars are colored blue with zero opacity, providing a clear visual distinction from the background.
- A horizontal line at zero (the "Zero Line") is added for reference, helping to identify periods of no price movement.
---
This indicator provides traders with a quick visualization of the price movement for each candlestick, helping to identify trends and potential trading opportunities.
Script open-source
Dans l'esprit TradingView, le créateur de ce script l'a rendu open source afin que les traders puissent examiner et vérifier ses fonctionnalités. Bravo à l'auteur! Bien que vous puissiez l'utiliser gratuitement, n'oubliez pas que la republication du code est soumise à nos Règles.
Clause de non-responsabilité
Les informations et publications ne sont pas destinées à être, et ne constituent pas, des conseils ou recommandations financiers, d'investissement, de trading ou autres fournis ou approuvés par TradingView. Pour en savoir plus, consultez les Conditions d'utilisation.