OPEN-SOURCE SCRIPT
Volume Pairwise Highlight
### Volume Pairwise Highlight
**Overview:**
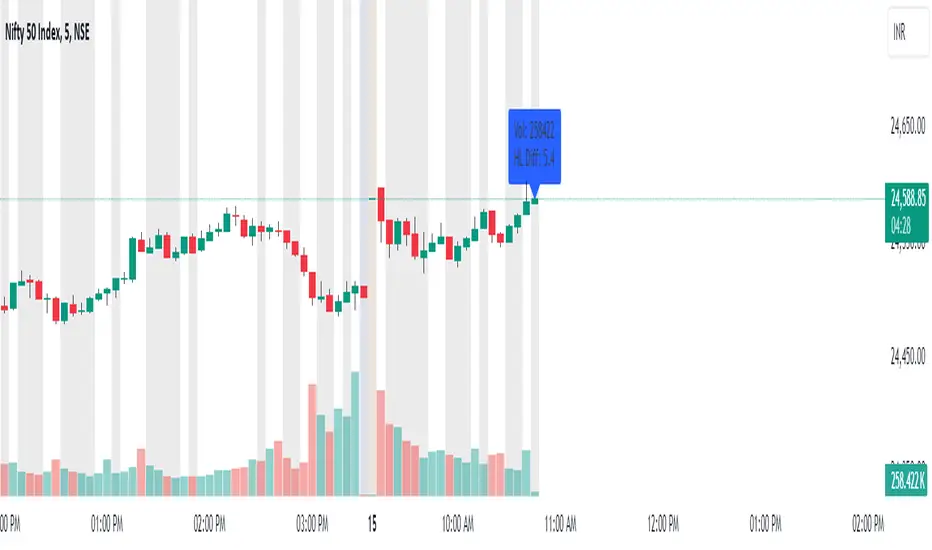
The "Volume Pairwise Highlight" Pine Script is designed to analyze and visualize the relationship between the volumes of consecutive candlesticks in a trading chart. This script calculates the high-low difference of each candlestick and plots it, while also highlighting specific conditions in the volume histogram.
**Key Features:**
1. **High-Low Difference Calculation:**
- The script calculates the difference between the high and low prices of each candlestick.
- This difference is plotted as a histogram on the main chart for easy visualization.
2. **Volume Condition Highlight:**
- The script checks if the volume of the previous candlestick is higher than the volume of the current candlestick.
- If this condition is met, the current volume bar is highlighted in red; otherwise, it is colored green.
- This helps traders quickly identify periods where there was a drop in volume compared to the previous period.
3. **Volume Display:**
- The volume is plotted as a histogram on a separate pane, making it easy to compare volumes across different periods.
- The coloring of the volume bars provides a quick visual cue for significant changes in trading volume.
4. **Information Display:**
- The script dynamically updates and displays the volume and high-low difference values on the chart.
- This provides traders with immediate feedback on the current trading activity.
5. **Optional Moving Average:**
- The script includes an optional moving average of the high-low difference.
- This moving average can be customized in length and helps smooth out the data for better trend analysis.
**Customization:**
- **Volume Threshold:** Customize the volume threshold to highlight specific volume conditions.
- **Highlight Color:** Adjust the highlight colors to suit your visual preferences.
- **Moving Average Length:** Modify the length of the moving average to better fit your analysis needs.
**Usage:**
This script is useful for traders looking to:
- Identify significant changes in trading volume.
- Analyze the volatility of candlesticks through high-low differences.
- Quickly spot periods of declining volume, which could indicate potential changes in market trends.
By providing clear visual cues and detailed volume analysis, the "Volume Pairwise Highlight" script aids traders in making more informed trading decisions.
**Overview:**
The "Volume Pairwise Highlight" Pine Script is designed to analyze and visualize the relationship between the volumes of consecutive candlesticks in a trading chart. This script calculates the high-low difference of each candlestick and plots it, while also highlighting specific conditions in the volume histogram.
**Key Features:**
1. **High-Low Difference Calculation:**
- The script calculates the difference between the high and low prices of each candlestick.
- This difference is plotted as a histogram on the main chart for easy visualization.
2. **Volume Condition Highlight:**
- The script checks if the volume of the previous candlestick is higher than the volume of the current candlestick.
- If this condition is met, the current volume bar is highlighted in red; otherwise, it is colored green.
- This helps traders quickly identify periods where there was a drop in volume compared to the previous period.
3. **Volume Display:**
- The volume is plotted as a histogram on a separate pane, making it easy to compare volumes across different periods.
- The coloring of the volume bars provides a quick visual cue for significant changes in trading volume.
4. **Information Display:**
- The script dynamically updates and displays the volume and high-low difference values on the chart.
- This provides traders with immediate feedback on the current trading activity.
5. **Optional Moving Average:**
- The script includes an optional moving average of the high-low difference.
- This moving average can be customized in length and helps smooth out the data for better trend analysis.
**Customization:**
- **Volume Threshold:** Customize the volume threshold to highlight specific volume conditions.
- **Highlight Color:** Adjust the highlight colors to suit your visual preferences.
- **Moving Average Length:** Modify the length of the moving average to better fit your analysis needs.
**Usage:**
This script is useful for traders looking to:
- Identify significant changes in trading volume.
- Analyze the volatility of candlesticks through high-low differences.
- Quickly spot periods of declining volume, which could indicate potential changes in market trends.
By providing clear visual cues and detailed volume analysis, the "Volume Pairwise Highlight" script aids traders in making more informed trading decisions.
Script open-source
Dans l'esprit TradingView, le créateur de ce script l'a rendu open source afin que les traders puissent examiner et vérifier ses fonctionnalités. Bravo à l'auteur! Bien que vous puissiez l'utiliser gratuitement, n'oubliez pas que la republication du code est soumise à nos Règles.
Clause de non-responsabilité
Les informations et publications ne sont pas destinées à être, et ne constituent pas, des conseils ou recommandations financiers, d'investissement, de trading ou autres fournis ou approuvés par TradingView. Pour en savoir plus, consultez les Conditions d'utilisation.