PROTECTED SOURCE SCRIPT
DrCID CLUB (HM SYSTEM)
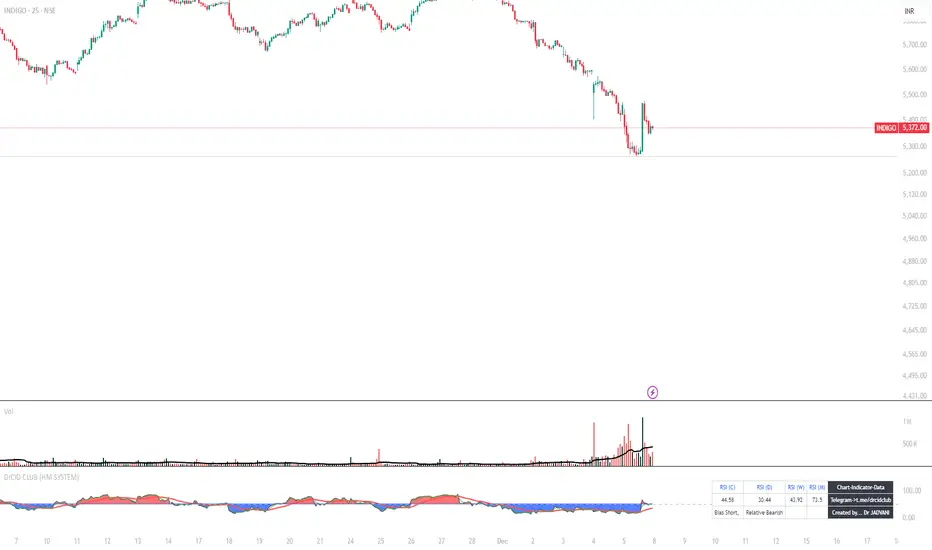
Blank line is RSI (9 days) line
Green line is EMA (3 days) line
Red line is WMA (21 days) line
when RSI EMA line above 50 & WMA is below both ,it is buy signal
when RSI EMA line below 50 & WMA is above both ,it is sell signal
Green line is EMA (3 days) line
Red line is WMA (21 days) line
when RSI EMA line above 50 & WMA is below both ,it is buy signal
when RSI EMA line below 50 & WMA is above both ,it is sell signal
Protected script
This script is published as closed-source. However, you can use it freely and without any limitations – learn more here.
Disclaimer
The information and publications are not meant to be, and do not constitute, financial, investment, trading, or other types of advice or recommendations supplied or endorsed by TradingView. Read more in the Terms of Use.