PROTECTED SOURCE SCRIPT
MACD Cross-over Zones
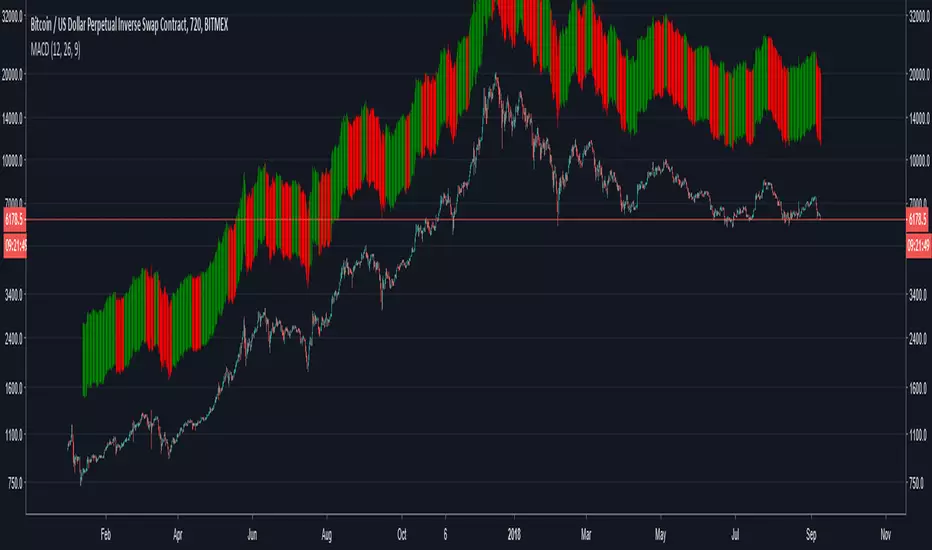
Bars above candles are color-based on MACD, when it turns bearish it will paint red and when it turns bullish green. Since the bars are painted above the candlestick one can see the price divergence in here too.
When one sees price is making higher highs or inside flat neutral momentum while MACD is in red, means weakness of selling.
When one sees price is making lower highs and MACD is red, it's signal that bears show strength and holding a short has more confidence until MACD turns green.
When one sees price is making lower highs and MACD is green, it's sign of weakness in buying, be cautious for reversal while holding (a long).
When one sees price is making higher highs and MACD is green, it's a sign of strength, one will be more confident holding a long until MACD turns red.
Script protégé
Ce script est publié en source fermée. Cependant, vous pouvez l'utiliser librement et sans aucune restriction – pour en savoir plus, cliquez ici.
Clause de non-responsabilité
Les informations et publications ne sont pas destinées à être, et ne constituent pas, des conseils ou recommandations financiers, d'investissement, de trading ou autres fournis ou approuvés par TradingView. Pour en savoir plus, consultez les Conditions d'utilisation.