OPEN-SOURCE SCRIPT
Mis à jour Recession Indicator (Unemployment Rate)
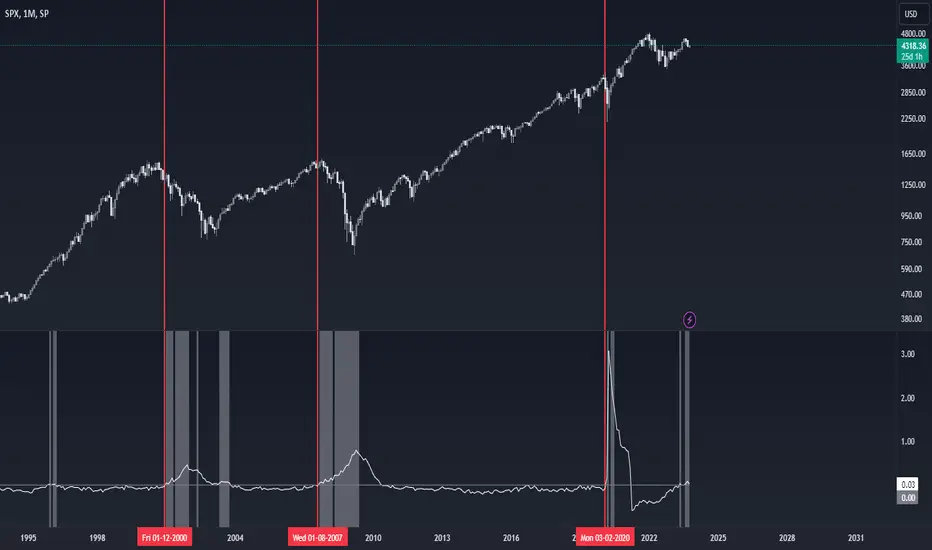
Unemployment rate
percentage of unemployed individuals in an economy among individuals currently in the labour force. It is calcuated as Unemployed IndividualsTotal Labour Force × 100 where unemployed individuals are those who are currently not working but are actively seeking work.
The unemployment rate is one of the primary economic indicators used to measure the health of an economy. It tends to fluctuate with the business cycle, increasing during recessions and decreasing during expansions. It is among the indicators most commonly watched by policy makers, investors, and the general public.
Policy makers and central banks consider how much the unemployment rate has increased during a particular recession to gauge the recession’s impact on the economy and to decide how to tailor fiscal and monetary policies to mitigate its adverse effects. In addition, central banks carefully try to predict the future trend of the unemployment rate to devise long-term strategies to lower it.
This indicator is a representation of yearly rate of change of Unemployment rate. Historically (not always) when ROC(Yearly) of Unemployment rate crossover zero line was a signal of recession or economic contraction.
Notes de version
Added commentsScript open-source
Dans l'esprit TradingView, le créateur de ce script l'a rendu open source afin que les traders puissent examiner et vérifier ses fonctionnalités. Bravo à l'auteur! Bien que vous puissiez l'utiliser gratuitement, n'oubliez pas que la republication du code est soumise à nos Règles.
Clause de non-responsabilité
Les informations et publications ne sont pas destinées à être, et ne constituent pas, des conseils ou recommandations financiers, d'investissement, de trading ou autres fournis ou approuvés par TradingView. Pour en savoir plus, consultez les Conditions d'utilisation.
Script open-source
Dans l'esprit TradingView, le créateur de ce script l'a rendu open source afin que les traders puissent examiner et vérifier ses fonctionnalités. Bravo à l'auteur! Bien que vous puissiez l'utiliser gratuitement, n'oubliez pas que la republication du code est soumise à nos Règles.
Clause de non-responsabilité
Les informations et publications ne sont pas destinées à être, et ne constituent pas, des conseils ou recommandations financiers, d'investissement, de trading ou autres fournis ou approuvés par TradingView. Pour en savoir plus, consultez les Conditions d'utilisation.