OPEN-SOURCE SCRIPT
Money Flow based probability
Money Flow based probability
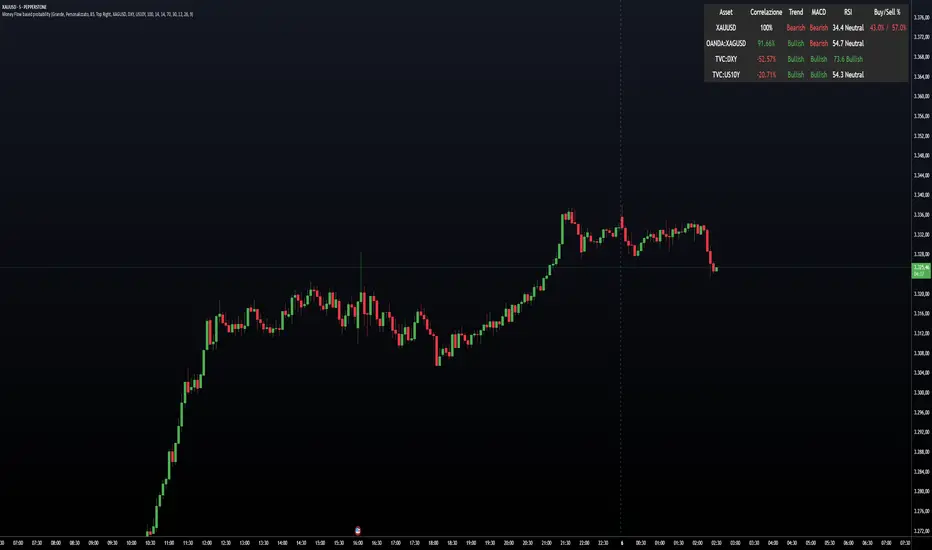
This indicator provides a comprehensive correlation and momentum analysis between your main asset and up to three selected correlated assets. It combines correlation, trend, momentum, and overbought/oversold signals into a single, easy-to-read table directly on your chart.
This indicator is ideal for traders who want to quickly assess the influence of major correlated markets and technical signals on their trading instrument, all in a single glance.
---
Example: Correlation Calculation
Pine Script®
Example: Table Output (Buy/Sell %)
Pine Script®
This indicator provides a comprehensive correlation and momentum analysis between your main asset and up to three selected correlated assets. It combines correlation, trend, momentum, and overbought/oversold signals into a single, easy-to-read table directly on your chart.
- Correlated Asset Selection:
You can select up to three correlated assets (e.g., indices, currencies, bonds) to compare with your main chart symbol. Each asset can be toggled on or off. - Correlation Calculation:
The indicator uses the native Pine Scriptfunction to measure the statistical relationship between the closing prices of your asset and each selected pair over a user-defined period.Pine Script® ta.correlation - Technical Analysis Integration:
For each asset (including the main one), the indicator calculates:
Trend direction using EMA (Exponential Moving Average) – optional
Momentum using MACD – optional
Overbought/oversold status using RSI – optional - Probability Scoring:
A weighted scoring system combines correlation, trend, MACD, RSI, and trend exhaustion signals to produce buy and sell probabilities for the main asset. - Visual Table Output:
A customizable table is displayed on the chart, showing:
Asset name
Correlation (as a percentage, -100% to +100%)
Trend (Bullish/Bearish)
MACD status (Bullish/Bearish)
RSI value and status
Buy/Sell probability (with fixed-width formatting for stability) - User Customization:
You can adjust:- Table size, color, and position
- Correlation period
- EMA, MACD, and RSI parameters
- Which assets to display
- Table size, color, and position
This indicator is ideal for traders who want to quickly assess the influence of major correlated markets and technical signals on their trading instrument, all in a single glance.
---
Example: Correlation Calculation
corrCurrentAsset1 = ta.correlation(close, asset1Data, correlationPeriod)
Example: Table Output (Buy/Sell %)
buyStr = f_formatPercent(buyProbability) + "%"
sellStr = f_formatPercent(sellProbability) + "%"
cellStr = buyStr + " / " + sellStr
Script open-source
Dans l'esprit TradingView, le créateur de ce script l'a rendu open source afin que les traders puissent examiner et vérifier ses fonctionnalités. Bravo à l'auteur! Bien que vous puissiez l'utiliser gratuitement, n'oubliez pas que la republication du code est soumise à nos Règles.
Clause de non-responsabilité
Les informations et publications ne sont pas destinées à être, et ne constituent pas, des conseils ou recommandations financiers, d'investissement, de trading ou autres fournis ou approuvés par TradingView. Pour en savoir plus, consultez les Conditions d'utilisation.