PROTECTED SOURCE SCRIPT
Gabriel's Asset Rotation System
📈 Gabriel's Asset Rotation System
Overview
Gabriel’s Asset Rotation System is an advanced multi-asset trend-following tool that dynamically ranks and rotates up to 6 assets (plus USD) based on a customizable trend scoring matrix. Using enhanced signal detection techniques like Cauchy-weighted Supertrend, Jurík RSX, Fisherized CCI, Kalman-filtered PSAR, and Dynamic DMI Smoothing, the system identifies the most dominant asset and simulates strategy equity performance compared to buy-and-hold benchmarks.
🔍 Key Features
✅ Multi-Asset Rotation: Analyze up to 6 symbols and USD simultaneously.
✅ Relative Strength Matrix: Compares every asset against each other to find outperformers.
✅ Custom Trend Engine:
Jurik RSX with advanced RSX logic
Fisherized CCI for momentum confirmation
Kalman-smoothed PSAR for trend bias
SuperTrend using a Cauchy Moving Average
Smoothed DMI signal across looped periods (10–17)
✅ Dynamic Best Asset Detection: Identifies and tracks the asset with the highest trend score over time.
✅ Performance Table: Displays Sharpe, Sortino, and Omega Ratios along with drawdowns and means for both strategy and each asset.
✅ Visual Trend Matrix: Tabular view of asset strength comparisons against each other + final scoring.
✅ Realistic Strategy Equity Curve: Tracks performance assuming full capital rotation into the best asset.
✅ Alerts: Get notified when the top-performing asset changes.
⚙️ Inputs
🔹 Assets: Customize 6 tickers (crypto, stocks, ETFs, etc.)
🔹 Trend Classification Method:
RSI
CCI
SuperTrend
DMI
PSAR
or use all together
🔹 Jurik RSX Length
🔹 Fisherized CCI Length
🔹 Cauchy MA Gamma and ATR Settings
🔹 DMI Range and MA Type (SMA, EMA, HMA, etc.)
🔹 PSAR Parameters with Kalman smoothing
🔹 Custom Backtest Start Date
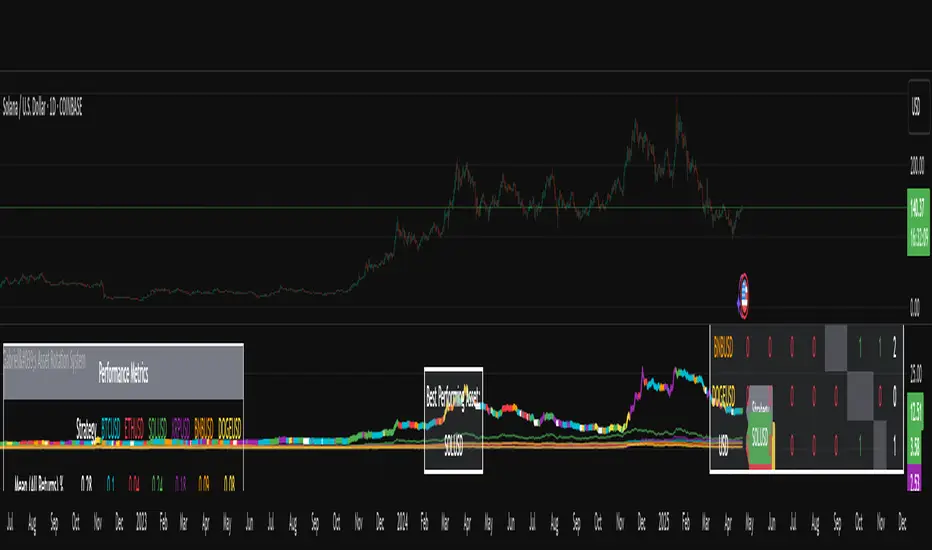
📊 Outputs
Plot 1: Best Asset Equity (colored dynamically)
Plot 2–7: Buy & Hold Curves for each asset (with labels)
Tables:
Rotation Matrix (bottom-right)
Best Performing Asset (bottom-center)
Performance Metrics Table (optional toggle)
🧠 Use Case Ideas
🔁 Dynamic Portfolio Rebalancing
⚖️ Compare Risk-Adjusted Returns Across Crypto or Stocks
🧪 Backtest Rotation Hypotheses
🚀 Identify Strongest Breakout Assets in Trend Environments
📉 Avoid Weakening Assets with Rising Drawdowns
🚨 Alerts
🔔 "New Optimal Asset": Triggers when a new top-ranking asset replaces the current one.
Overview
Gabriel’s Asset Rotation System is an advanced multi-asset trend-following tool that dynamically ranks and rotates up to 6 assets (plus USD) based on a customizable trend scoring matrix. Using enhanced signal detection techniques like Cauchy-weighted Supertrend, Jurík RSX, Fisherized CCI, Kalman-filtered PSAR, and Dynamic DMI Smoothing, the system identifies the most dominant asset and simulates strategy equity performance compared to buy-and-hold benchmarks.
🔍 Key Features
✅ Multi-Asset Rotation: Analyze up to 6 symbols and USD simultaneously.
✅ Relative Strength Matrix: Compares every asset against each other to find outperformers.
✅ Custom Trend Engine:
Jurik RSX with advanced RSX logic
Fisherized CCI for momentum confirmation
Kalman-smoothed PSAR for trend bias
SuperTrend using a Cauchy Moving Average
Smoothed DMI signal across looped periods (10–17)
✅ Dynamic Best Asset Detection: Identifies and tracks the asset with the highest trend score over time.
✅ Performance Table: Displays Sharpe, Sortino, and Omega Ratios along with drawdowns and means for both strategy and each asset.
✅ Visual Trend Matrix: Tabular view of asset strength comparisons against each other + final scoring.
✅ Realistic Strategy Equity Curve: Tracks performance assuming full capital rotation into the best asset.
✅ Alerts: Get notified when the top-performing asset changes.
⚙️ Inputs
🔹 Assets: Customize 6 tickers (crypto, stocks, ETFs, etc.)
🔹 Trend Classification Method:
RSI
CCI
SuperTrend
DMI
PSAR
or use all together
🔹 Jurik RSX Length
🔹 Fisherized CCI Length
🔹 Cauchy MA Gamma and ATR Settings
🔹 DMI Range and MA Type (SMA, EMA, HMA, etc.)
🔹 PSAR Parameters with Kalman smoothing
🔹 Custom Backtest Start Date
📊 Outputs
Plot 1: Best Asset Equity (colored dynamically)
Plot 2–7: Buy & Hold Curves for each asset (with labels)
Tables:
Rotation Matrix (bottom-right)
Best Performing Asset (bottom-center)
Performance Metrics Table (optional toggle)
🧠 Use Case Ideas
🔁 Dynamic Portfolio Rebalancing
⚖️ Compare Risk-Adjusted Returns Across Crypto or Stocks
🧪 Backtest Rotation Hypotheses
🚀 Identify Strongest Breakout Assets in Trend Environments
📉 Avoid Weakening Assets with Rising Drawdowns
🚨 Alerts
🔔 "New Optimal Asset": Triggers when a new top-ranking asset replaces the current one.
Script protégé
Ce script est publié en source fermée. Cependant, vous pouvez l'utiliser librement et sans aucune restriction – pour en savoir plus, cliquez ici.
Gabriel Amadeus
The Real World - Stocks Campus:
Stocks, Options, Futures, Forex, Crypto, this is what we trade.
Learn profitable trading systems or build your own, just like I did.
jointherealworld.com/?a=f7jkjpg8kh
The Real World - Stocks Campus:
Stocks, Options, Futures, Forex, Crypto, this is what we trade.
Learn profitable trading systems or build your own, just like I did.
jointherealworld.com/?a=f7jkjpg8kh
Clause de non-responsabilité
Les informations et publications ne sont pas destinées à être, et ne constituent pas, des conseils ou recommandations financiers, d'investissement, de trading ou autres fournis ou approuvés par TradingView. Pour en savoir plus, consultez les Conditions d'utilisation.