OPEN-SOURCE SCRIPT
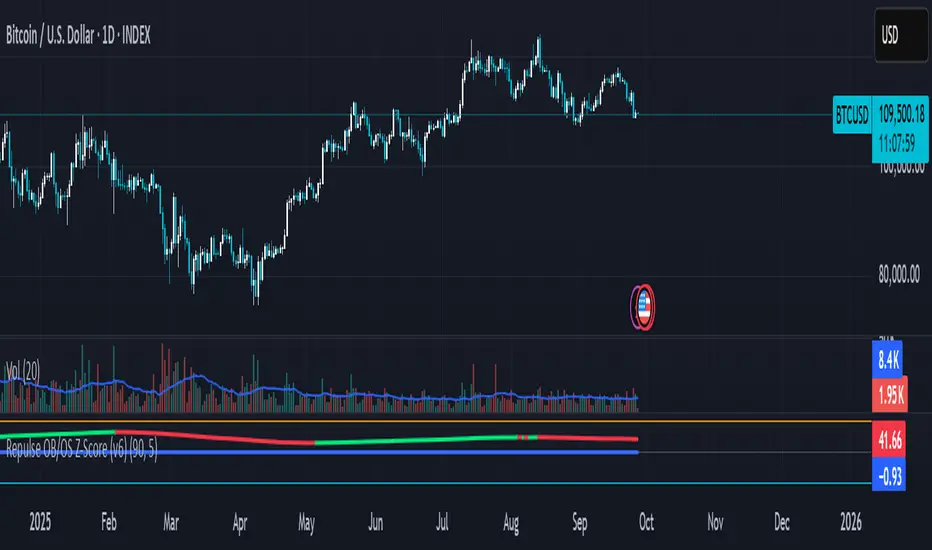
Repulse OB/OS Z-Score (v3)
🔹 What this script does
This indicator is an enhanced version of the Repulse, originally developed by Eric Lefort. The Repulse measures bullish and bearish pressure in the market by analyzing price momentum and crowd behavior.
In this version, I introduce a Z-Score transformation to the Repulse values. The Z-Score converts raw outputs into a standardized statistical scale, allowing traders to identify when pressure is abnormally high or low relative to historical conditions.
🔹 How it works
Repulse Core: The original Repulse calculation compares buying vs. selling pressure, highlighting shifts in momentum.
Z-Scoring Method: Repulse values are normalized around their mean and scaled by standard deviation. This transforms the indicator into a dimensionless metric, where:
Positive Z-Scores indicate stronger-than-usual bullish pressure.
Negative Z-Scores indicate stronger-than-usual bearish pressure.
Bands: Thresholds such as ±1 or ±2 Z-Scores can help detect when pressure is stretched, potentially signaling exhaustion or reversal points.
🔹 Why it’s useful
Statistical Clarity: Traders can instantly see whether current pressure is normal or extreme.
Cross-Asset Comparisons: Because Z-Scores are standardized, signals can be compared across different markets or timeframes.
Mean Reversion Tool: Extreme Z-Score values often precede turning points, making this a versatile addition to trend and momentum analysis.
🔹 How to use it
Apply the indicator to any chart and timeframe.
Watch for Z-Scores above +2 (possible overheated bullish pressure) or below –2 (possible oversold/exhaustion).
Use these levels as contextual signals, not standalone triggers. Best results come from combining with price structure, support/resistance, or volume analysis.
⚠️ Note: This script does not predict price. It highlights statistical extremes in pressure to support decision-making. Always use in combination with other tools and risk management practices.
Script open-source
Dans l'esprit TradingView, le créateur de ce script l'a rendu open source afin que les traders puissent examiner et vérifier ses fonctionnalités. Bravo à l'auteur! Bien que vous puissiez l'utiliser gratuitement, n'oubliez pas que la republication du code est soumise à nos Règles.
Clause de non-responsabilité
Les informations et publications ne sont pas destinées à être, et ne constituent pas, des conseils ou recommandations financiers, d'investissement, de trading ou autres fournis ou approuvés par TradingView. Pour en savoir plus, consultez les Conditions d'utilisation.