OPEN-SOURCE SCRIPT
Mis à jour RSI Trendspotter
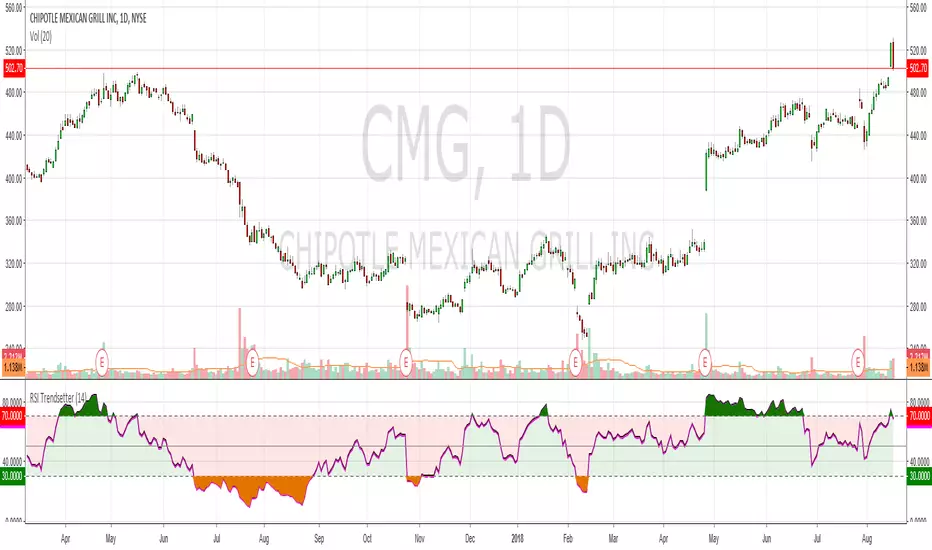
Had a bit of a TA epiphany with RSI so bear with me. The time since RSI was last overbought/sold is a solid trend indicator. This may seem obvious but after x number of years trading it hit me like a smack in the face. I've coded this for easy visualisation. They're fairly simple changes but it's making a big difference in my trendspotting already.
In the example CMG hasn't been overbought for 183 days, so the RSI is mostly green:
Before that it hadn't been oversold for 199 days, so RSI is mostly red:
And before that it was ranging like a maf*ckin' sine wave, so the RSI shows green, red, green, red, etc.:
Finally, normal RSI for comparison. Same data, but now with pretty colours:
I've also added overbought/oversold highlights cause that just makes the whole charting thing a lot easier. Enjoy!
Notes de version
Bugger, I said overbought when I mean oversold and vice-versaNotes de version
Added plot descriptions so peeps and change colours easily. Thanks to FLOW for the feedbackNotes de version
Fixed an issue with colour and the source. Due to Pine Script limitations it's not possible to make this look the same on a black chart, so you will need to manually adjust the colours when you add it to your chartScript open-source
Dans l'esprit TradingView, le créateur de ce script l'a rendu open source afin que les traders puissent examiner et vérifier ses fonctionnalités. Bravo à l'auteur! Bien que vous puissiez l'utiliser gratuitement, n'oubliez pas que la republication du code est soumise à nos Règles.
Clause de non-responsabilité
Les informations et publications ne sont pas destinées à être, et ne constituent pas, des conseils ou recommandations financiers, d'investissement, de trading ou autres fournis ou approuvés par TradingView. Pour en savoir plus, consultez les Conditions d'utilisation.
Script open-source
Dans l'esprit TradingView, le créateur de ce script l'a rendu open source afin que les traders puissent examiner et vérifier ses fonctionnalités. Bravo à l'auteur! Bien que vous puissiez l'utiliser gratuitement, n'oubliez pas que la republication du code est soumise à nos Règles.
Clause de non-responsabilité
Les informations et publications ne sont pas destinées à être, et ne constituent pas, des conseils ou recommandations financiers, d'investissement, de trading ou autres fournis ou approuvés par TradingView. Pour en savoir plus, consultez les Conditions d'utilisation.