OPEN-SOURCE SCRIPT
Mis à jour [Venturose] MACD x BB x STDEV x RVI

Description:
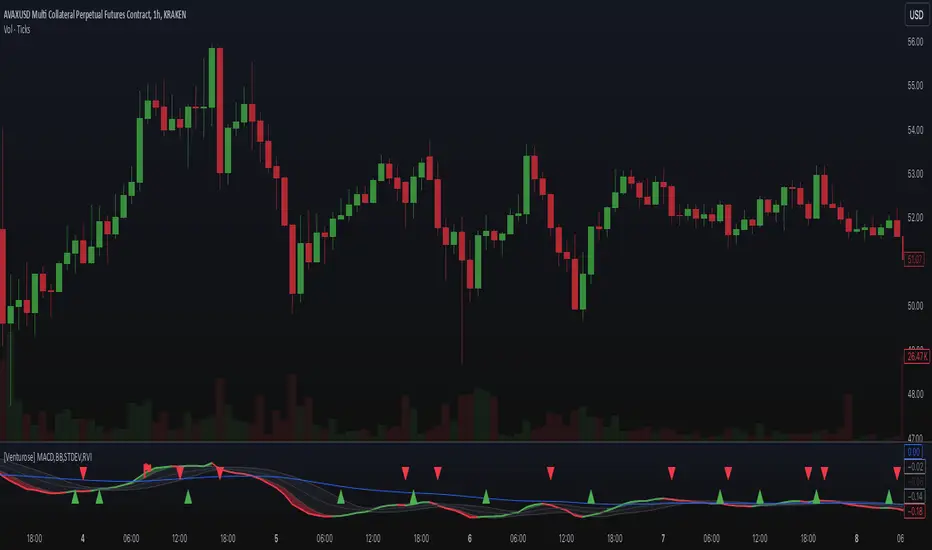
The [Venturose] MACD x BB x STDEV x RVI combines MACD, Bollinger Bands, Standard Deviation, and Relative Volatility Index into a single tool. This indicator is designed to provide insights into market trends, momentum, and volatility. It generates buy and sell signals, by analyzing the interactions between these components. These buy and sell signals are not literal, and should be used in combination with the current trend.
How It Works:
Key Features:
Why It’s Unique:
This indicator combines momentum (MACD), volatility (Bollinger Bands and Standard Deviation), and confirmation signals (RVI thresholds) into a unified system. It introduces custom "inside" and "flipped" triggers for adaptable signal generation and includes signal filtering to reduce noise. The addition of RVI-based hints helps identify early overbought or oversold conditions, providing an extra layer of insight for decision-making. The dynamic integration of these components ensures a comprehensive yet straightforward analysis tool for various market conditions.
The [Venturose] MACD x BB x STDEV x RVI combines MACD, Bollinger Bands, Standard Deviation, and Relative Volatility Index into a single tool. This indicator is designed to provide insights into market trends, momentum, and volatility. It generates buy and sell signals, by analyzing the interactions between these components. These buy and sell signals are not literal, and should be used in combination with the current trend.
How It Works:
- MACD: Tracks momentum and trend direction using customizable fast and slow EMA periods.
- Bollinger Bands: Adds volatility bands to MACD to identify overextension zones.
- Standard Deviation: Dynamically adjusts the Bollinger Band width based on MACD volatility.
- RVI (Relative Volatility Index): Confirms momentum extremes with upper and lower threshold markers.
- Custom Logic: Includes a trigger system ("inside" or "flipped") to adapt signals to various market conditions and an optional filter to reduce noise.
Key Features:
- Combines MACD and Bollinger Bands with volatility and momentum confirmations from RVI.
- Dynamic color-coded plots for identifying bullish, bearish, and neutral trends.
- Customizable parameters for tailoring the indicator to different strategies.
- Optional signal filtering to refine buy and sell triggers.
- Alerts for buy and sell signals based on signal logic.
Why It’s Unique:
This indicator combines momentum (MACD), volatility (Bollinger Bands and Standard Deviation), and confirmation signals (RVI thresholds) into a unified system. It introduces custom "inside" and "flipped" triggers for adaptable signal generation and includes signal filtering to reduce noise. The addition of RVI-based hints helps identify early overbought or oversold conditions, providing an extra layer of insight for decision-making. The dynamic integration of these components ensures a comprehensive yet straightforward analysis tool for various market conditions.
Notes de version
New Update: Long-Term Average Smoothing with CustomizationThis update introduces a customizable EMA for smoothing the long-term average. You can tailor the period and color to suit your preferences, allowing for a personalized visualization. Note that while this feature enhances trend clarity, it does not currently impact the indicator's signals.
Script open-source
Dans l'esprit TradingView, le créateur de ce script l'a rendu open source afin que les traders puissent examiner et vérifier ses fonctionnalités. Bravo à l'auteur! Bien que vous puissiez l'utiliser gratuitement, n'oubliez pas que la republication du code est soumise à nos Règles.
Clause de non-responsabilité
Les informations et publications ne sont pas destinées à être, et ne constituent pas, des conseils ou recommandations financiers, d'investissement, de trading ou autres fournis ou approuvés par TradingView. Pour en savoir plus, consultez les Conditions d'utilisation.