OPEN-SOURCE SCRIPT
ATR Bands
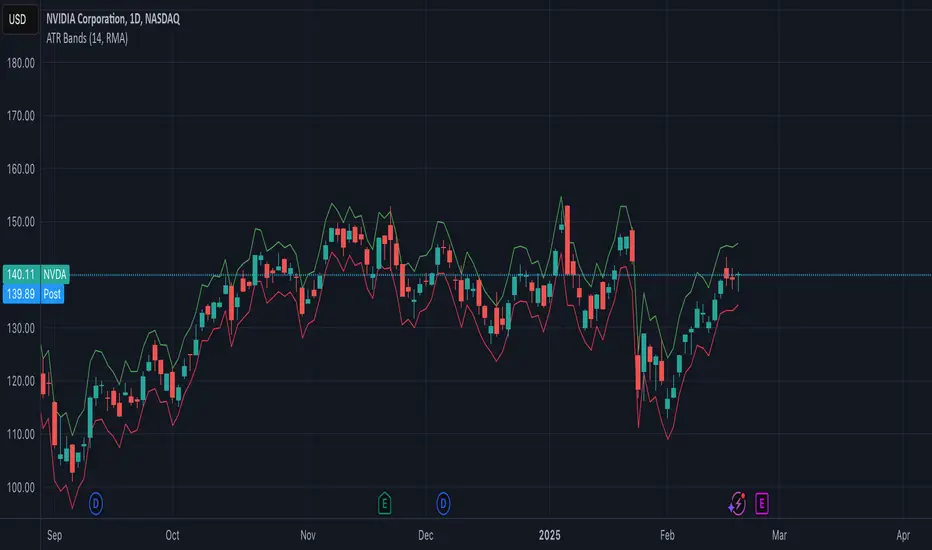
The ATR Bands indicator is a volatility-based tool that plots dynamic support and resistance levels around the price using the Average True Range (ATR). It consists of two bands:
Upper Band: Calculated as current price + ATR, representing an upper volatility threshold.
Lower Band: Calculated as current price - ATR, serving as a lower volatility threshold.
Key Features:
✅ Measures Volatility: Expands and contracts based on market volatility.
✅ Dynamic Support & Resistance: Helps identify potential breakout or reversal zones.
✅ Customizable Smoothing: Supports multiple moving average methods (RMA, SMA, EMA, WMA) for ATR calculation.
How to Use:
Trend Confirmation: If the price consistently touches or exceeds the upper band, it may indicate strong bullish momentum.
Reversal Signals: A price approaching the lower band may suggest a potential reversal or increased selling pressure.
Volatility Assessment: Wide bands indicate high volatility, while narrow bands suggest consolidation.
This indicator is useful for traders looking to incorporate volatility-based strategies into their trading decisions
Script open-source
Dans l'esprit TradingView, le créateur de ce script l'a rendu open source afin que les traders puissent examiner et vérifier ses fonctionnalités. Bravo à l'auteur! Bien que vous puissiez l'utiliser gratuitement, n'oubliez pas que la republication du code est soumise à nos Règles.
Clause de non-responsabilité
Les informations et publications ne sont pas destinées à être, et ne constituent pas, des conseils ou recommandations financiers, d'investissement, de trading ou autres fournis ou approuvés par TradingView. Pour en savoir plus, consultez les Conditions d'utilisation.