OPEN-SOURCE SCRIPT
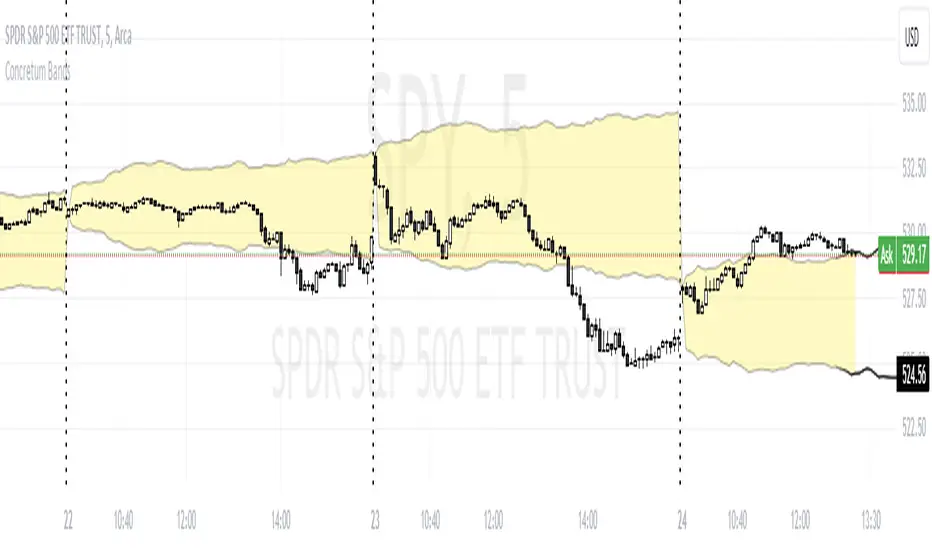
Concretum Bands
Definition
The Concretum Bands indicator recreates the Upper and Lower Bound of the Noise Area described in the paper "Beat the Market: An Effective Intraday Momentum Strategy for S&P500 ETF (SPY)" published by Concretum founder Zarattini, along with Barbon and Aziz, in May 2024.
Below we provide all the information required to understand how the indicator is calculated, the rationale behind it and how people can use it.
Idea Behind
The indicator aims to outline an intraday price region where the stock is expected to move without indicating any demand/supply imbalance. When the price crosses the boundaries of the Noise Area, it suggests a significant imbalance that may trigger an intraday trend.
How the Indicator is Calculated
The bands at time HH:MM are computed by taking the open price of day t and then adding/subtracting the average absolute move over the last n days from market open to minute HH:MM. The bands are also adjusted to account for overnight gaps. A volatility multiplier can be used to increase/decrease the width of the bands, similar to other well-known technical bands. The bands described in the paper were computed using a lookback period (length) of 14 days and a Volatility Multiplier of 1. Users can easily adjust these settings.
How to use the indicator
A trader may use this indicator to identify intraday moves that exceed the average move over the most recent period. A break outside the bands could be used as a signal of significant demand/supply imbalance.
Script open-source
Dans l'esprit TradingView, le créateur de ce script l'a rendu open source afin que les traders puissent examiner et vérifier ses fonctionnalités. Bravo à l'auteur! Bien que vous puissiez l'utiliser gratuitement, n'oubliez pas que la republication du code est soumise à nos Règles.
Clause de non-responsabilité
Les informations et publications ne sont pas destinées à être, et ne constituent pas, des conseils ou recommandations financiers, d'investissement, de trading ou autres fournis ou approuvés par TradingView. Pour en savoir plus, consultez les Conditions d'utilisation.