OPEN-SOURCE SCRIPT
Mis à jour Bullish vs. Bearish Candle Counter
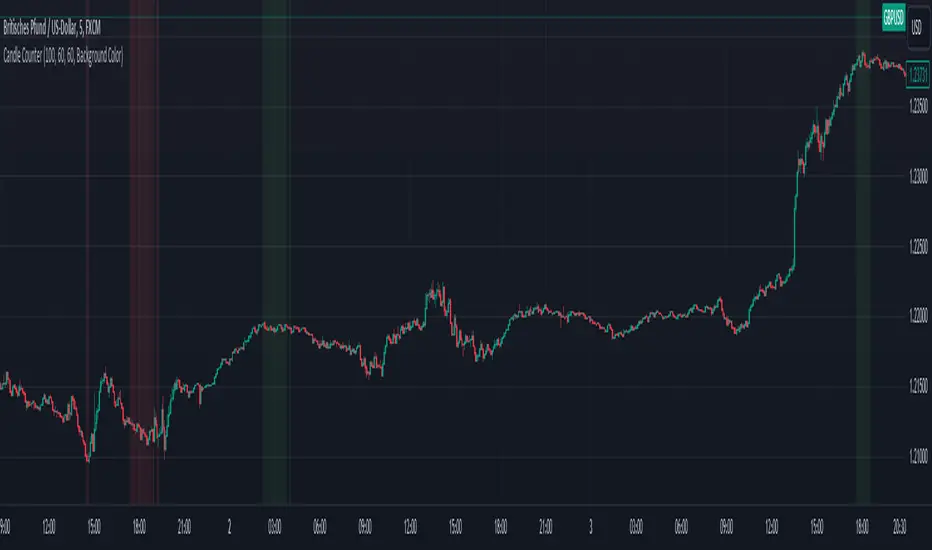
Following an exhaustive analysis of the most recent 50,000 candles within a given currency pair, a notable equilibrium between bearish and bullish candles has emerged as a persistent market phenomenon. This equilibrium, indicative of the market's continuous endeavor to establish parity, has spurred the development of the following indicator.
The indicator meticulously scrutinizes the preceding 100 candles, promptly triggering an on-chart marker when either bullish or bearish candle counts surpass the threshold of 60%. This marker serves as an invaluable tool, providing traders with a potential signal for the initiation of a trend reversal.
As such, this indicator serves as a valuable asset in a trader's toolkit, offering insights into shifts in market sentiment and the prospect of emerging trends.
Key Features:
- Customizable Candle Count: Traders can set the number of candlesticks to be analyzed in the input parameters, allowing flexibility in their analysis.
- Bullish and Bearish Percentage: Users can define their desired percentage for both bullish and bearish candles in the indicator's settings. The indicator calculates the percentage of each candle type within the specified range.
- Arrow Signals: The indicator plots arrows above or below the current candle, indicating bullish or bearish conditions based on the defined percentage thresholds. A green arrow signifies bullish sentiment, while a red arrow denotes bearish sentiment.
How to Use:
- Adjust Parameters: In the indicator settings, users can customize the number of candlesticks to be analyzed, as well as set their preferred percentages for both bullish and bearish conditions.
- Interpret Arrows: The indicator generates arrows above or below the current candle, reflecting the prevailing market sentiment. A green arrow suggests a bullish bias, while a red arrow indicates a bearish bias.
- Trade with Confidence: Traders can use this indicator as a tool to gauge market sentiment and make informed trading decisions. It helps identify potential entry and exit points based on the chosen percentage thresholds.
Notes de version
You can now switch between the options of a colored background and arrows.Script open-source
Dans l'esprit TradingView, le créateur de ce script l'a rendu open source afin que les traders puissent examiner et vérifier ses fonctionnalités. Bravo à l'auteur! Bien que vous puissiez l'utiliser gratuitement, n'oubliez pas que la republication du code est soumise à nos Règles.
Clause de non-responsabilité
Les informations et publications ne sont pas destinées à être, et ne constituent pas, des conseils ou recommandations financiers, d'investissement, de trading ou autres fournis ou approuvés par TradingView. Pour en savoir plus, consultez les Conditions d'utilisation.
Script open-source
Dans l'esprit TradingView, le créateur de ce script l'a rendu open source afin que les traders puissent examiner et vérifier ses fonctionnalités. Bravo à l'auteur! Bien que vous puissiez l'utiliser gratuitement, n'oubliez pas que la republication du code est soumise à nos Règles.
Clause de non-responsabilité
Les informations et publications ne sont pas destinées à être, et ne constituent pas, des conseils ou recommandations financiers, d'investissement, de trading ou autres fournis ou approuvés par TradingView. Pour en savoir plus, consultez les Conditions d'utilisation.