OPEN-SOURCE SCRIPT
Mis à jour Daily ATR Cave
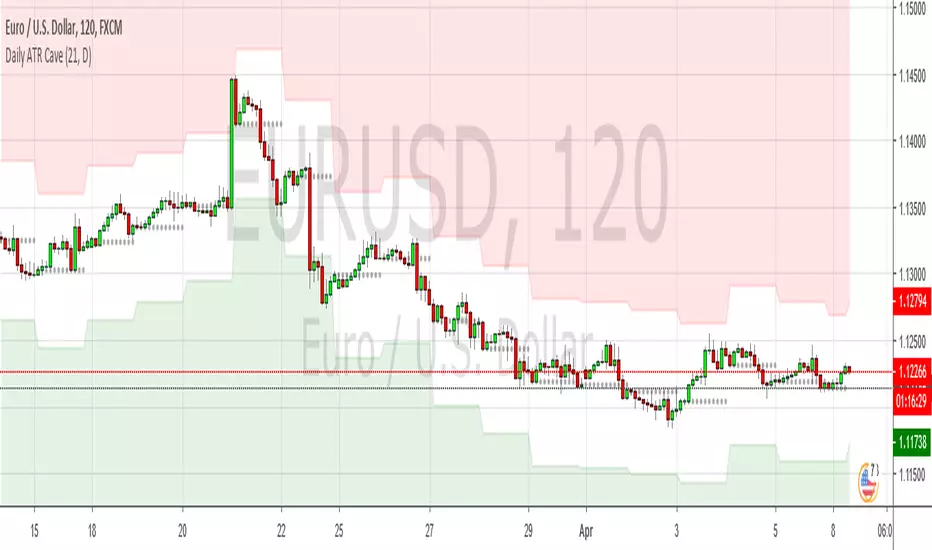
Similar to the RSI Cave idea, this plots daily Average True Range values on lower timeframes, as well as the daily open level, which is show as a grey dotted line. Basically a simple way to visualise basic mean reversion stuff
Notes de version
Updated code to use tickerid instead of ticker. This makes sure the code is referencing the current exchange and ticker, not just the ticker. Thanks to @k_dub1 for the tipScript open-source
Dans l'esprit TradingView, le créateur de ce script l'a rendu open source afin que les traders puissent examiner et vérifier ses fonctionnalités. Bravo à l'auteur! Bien que vous puissiez l'utiliser gratuitement, n'oubliez pas que la republication du code est soumise à nos Règles.
Clause de non-responsabilité
Les informations et publications ne sont pas destinées à être, et ne constituent pas, des conseils ou recommandations financiers, d'investissement, de trading ou autres fournis ou approuvés par TradingView. Pour en savoir plus, consultez les Conditions d'utilisation.
Script open-source
Dans l'esprit TradingView, le créateur de ce script l'a rendu open source afin que les traders puissent examiner et vérifier ses fonctionnalités. Bravo à l'auteur! Bien que vous puissiez l'utiliser gratuitement, n'oubliez pas que la republication du code est soumise à nos Règles.
Clause de non-responsabilité
Les informations et publications ne sont pas destinées à être, et ne constituent pas, des conseils ou recommandations financiers, d'investissement, de trading ou autres fournis ou approuvés par TradingView. Pour en savoir plus, consultez les Conditions d'utilisation.