MTF BB%+ [Osc] [Intromoto]
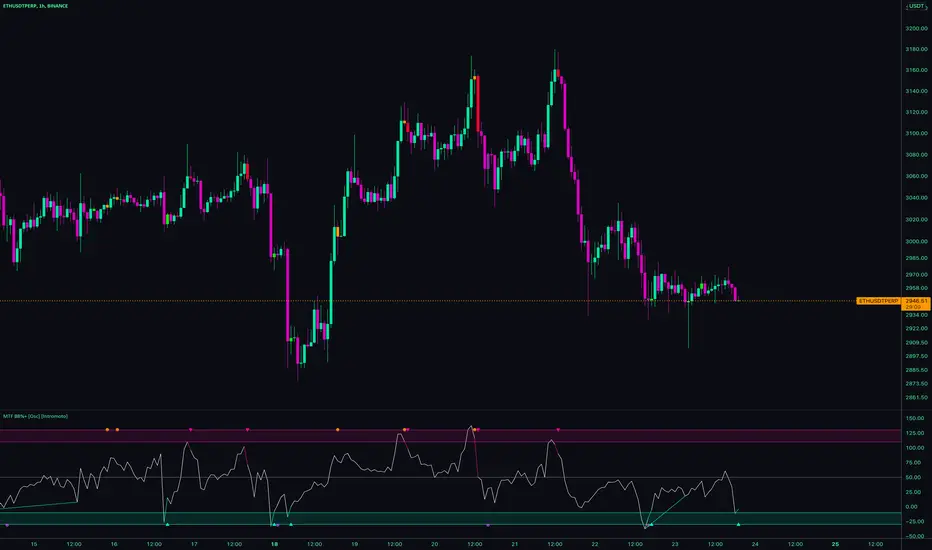
Plotshapes are printed when exiting extremes of the deviations, back towards the mean.
Arrows indicate an increased likelihood of price reverting direction. Red arrow =bearish, green arrow = bullish.
Dots on the top and bottom of the oscillator show a sub level of reversion that would be perhaps less extreme than when price reenters the norm from the normal standard deviation.
Users can also change the timeframe of the indicator for high time frame signals.
Barcolors for plotshapes included.
DM for access
Thanks
Script sur invitation seulement
Seuls les utilisateurs approuvés par l'auteur peuvent accéder à ce script. Vous devrez demander et obtenir l'autorisation pour l'utiliser. Celle-ci est généralement accordée après paiement. Pour plus de détails, suivez les instructions de l'auteur ci-dessous ou contactez directement Intromoto.
TradingView ne recommande PAS d'acheter ou d'utiliser un script à moins que vous ne fassiez entièrement confiance à son auteur et que vous compreniez son fonctionnement. Vous pouvez également trouver des alternatives gratuites et open source dans nos scripts communautaires.
Instructions de l'auteur
Follow on Twitter for updates.
One time fee, no subscription
twitter.com/IntroMoto
Clause de non-responsabilité
Script sur invitation seulement
Seuls les utilisateurs approuvés par l'auteur peuvent accéder à ce script. Vous devrez demander et obtenir l'autorisation pour l'utiliser. Celle-ci est généralement accordée après paiement. Pour plus de détails, suivez les instructions de l'auteur ci-dessous ou contactez directement Intromoto.
TradingView ne recommande PAS d'acheter ou d'utiliser un script à moins que vous ne fassiez entièrement confiance à son auteur et que vous compreniez son fonctionnement. Vous pouvez également trouver des alternatives gratuites et open source dans nos scripts communautaires.
Instructions de l'auteur
Follow on Twitter for updates.
One time fee, no subscription
twitter.com/IntroMoto