OPEN-SOURCE SCRIPT
Level Founder indicator
Questo strumento, ideato per l'individuazione dei livelli orizzontali sensibili si prepone l'obiettivo di semplificare la lettura tecnica dei grafici. Alla base di questo indicatore c'è il concetto di volatilità, inteso come scontro tra domanda ed offerta, come escursione delle forze nel campo di battaglia fino alla determinazione del prezzo finale di ogni candela. Di fatto, andando a cogliere quella che è la volatilità candela per candela, l'indicatore la calcola in termini assoluti rendendola un numericamente comparabile, in un range tra 0 e 100. Quando questo valore tocca i 100 si genera un picco di volatilità, il quale va ad identificare un punto di attenzione sul grafico di uno strumento. In corrispondenza di questi picchi si osserva dove la battaglia tra compratori e venditori si è conclusa, ovvero dove domanda ed offerta si sono incontrati per definire un prezzo: la chiusura di candela. In corrispondenza di tale prezzo si ha, quindi, un accordo certo tra domanda ed offerta dopo un periodo di contrattazione volatile, andando a certificare quello che è un livello di prezzo "sudato" per un determinato sottostante. Tale soglia si traduce in un livello orizzontale sensibile, che in futuro (avendo il mercato memoria degli scontri passati) potrà comportarsi da supporto o da resistenza, a seconda della situazione. In breve quindi, si traccia una linea orizzontale in corrispondenza delle chiusure di candela che condividono un picco sull'indicatore "Level Founder Indicator". Funziona su ogni time-frame e sottostante.
N.B. A ridosso di questi livelli si possono cercare pattern per l'operatività oppure cercare delle rotture di questi livelli per delle conferme/inversioni, spaziando dal trading intraday all'investimento di lungo periodo.
ENGLISH VERSION:
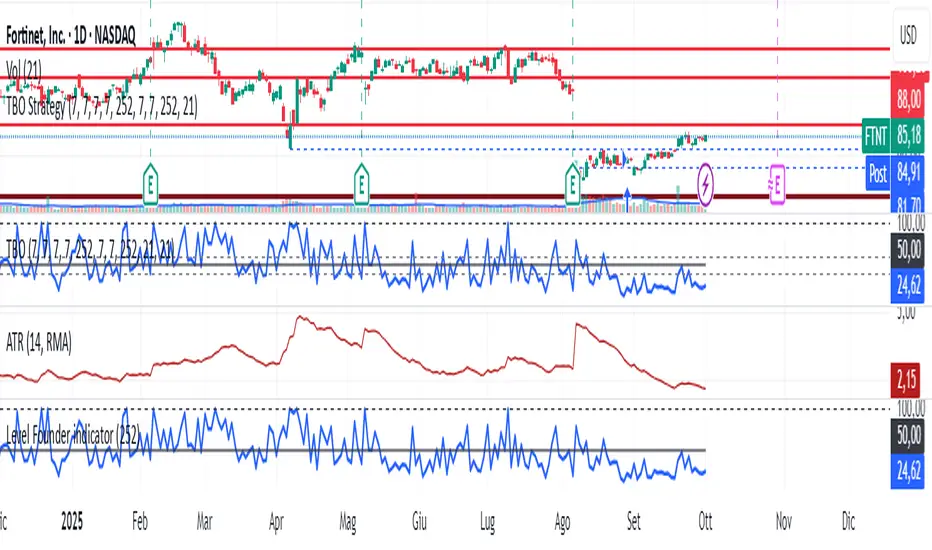
This tool, designed to identify sensitive horizontal levels, aims to simplify the technical reading of charts. This indicator is based on the concept of volatility, understood as the clash between supply and demand, the oscillation of forces on the battlefield until the final price of each candlestick is determined. By capturing the volatility candlestick by candlestick, the indicator calculates it in absolute terms, making it numerically comparable, within a range between 0 and 100. When this value reaches 100, a volatility spike is generated, which identifies a point of focus on an instrument's chart. At these peaks, we observe where the battle between buyers and sellers has concluded, that is, where supply and demand have met to define a price: the candlestick's close. At this price, therefore, a definite agreement between supply and demand occurs after a period of volatile trading, certifying what is a "hard-earned" price level for a given underlying asset. This threshold translates into a sensitive horizontal level, which in the future (given the market's memory of past clashes) could act as support or resistance, depending on the situation. In short, a horizontal line is drawn at the candlestick closes that share a peak on the "Level Founder Indicator." It works on any timeframe and underlying asset.
N.B.: Near these levels, you can look for trading patterns or look for breakouts of these levels for confirmations/reversals, ranging from intraday trading to long-term investing.
N.B. A ridosso di questi livelli si possono cercare pattern per l'operatività oppure cercare delle rotture di questi livelli per delle conferme/inversioni, spaziando dal trading intraday all'investimento di lungo periodo.
ENGLISH VERSION:
This tool, designed to identify sensitive horizontal levels, aims to simplify the technical reading of charts. This indicator is based on the concept of volatility, understood as the clash between supply and demand, the oscillation of forces on the battlefield until the final price of each candlestick is determined. By capturing the volatility candlestick by candlestick, the indicator calculates it in absolute terms, making it numerically comparable, within a range between 0 and 100. When this value reaches 100, a volatility spike is generated, which identifies a point of focus on an instrument's chart. At these peaks, we observe where the battle between buyers and sellers has concluded, that is, where supply and demand have met to define a price: the candlestick's close. At this price, therefore, a definite agreement between supply and demand occurs after a period of volatile trading, certifying what is a "hard-earned" price level for a given underlying asset. This threshold translates into a sensitive horizontal level, which in the future (given the market's memory of past clashes) could act as support or resistance, depending on the situation. In short, a horizontal line is drawn at the candlestick closes that share a peak on the "Level Founder Indicator." It works on any timeframe and underlying asset.
N.B.: Near these levels, you can look for trading patterns or look for breakouts of these levels for confirmations/reversals, ranging from intraday trading to long-term investing.
Script open-source
Dans l'esprit TradingView, le créateur de ce script l'a rendu open source afin que les traders puissent examiner et vérifier ses fonctionnalités. Bravo à l'auteur! Bien que vous puissiez l'utiliser gratuitement, n'oubliez pas que la republication du code est soumise à nos Règles.
Clause de non-responsabilité
Les informations et publications ne sont pas destinées à être, et ne constituent pas, des conseils ou recommandations financiers, d'investissement, de trading ou autres fournis ou approuvés par TradingView. Pour en savoir plus, consultez les Conditions d'utilisation.