Stock Crash Risk (SCR)
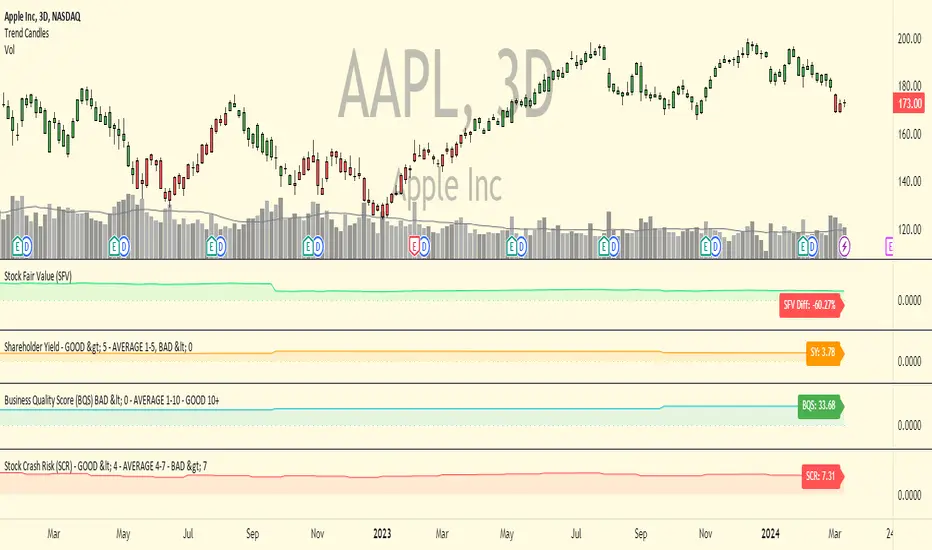
The indicator uses both price action and fundamental valuation metrics to calculate the reading. Generally speaking, when a stock price exhibits both extreme price sentiment and valuation it's likely to crash at some point. This indicator can also be used for the opposite use, meaning when it has a low reading under 3 it could be a good time to buy since both price and valuation are low.
This indicator is best used on stocks on the daily, weekly and monthly timeframes. It's value will always be the same regardless of what timeframe is used. Since it uses stock valuation this indicator cannot be used on other markets like forex, futures or crypto.
In the chart above you can see it applied to Peloton
Below is another example of Zoom Video
Here's another example with Upstart
To get access to this indicator PM or email me to my address shown below.
Enjoy :)
Disclaimer: All my scripts and content are for educational purposes only. I'm not a financial advisor and do not give personal finance advice. Past performance is no guarantee of future performance. Please trade at your own risk.
Script sur invitation seulement
Seuls les utilisateurs approuvés par l'auteur peuvent accéder à ce script. Vous devrez demander et obtenir l'autorisation pour l'utiliser. Celle-ci est généralement accordée après paiement. Pour plus de détails, suivez les instructions de l'auteur ci-dessous ou contactez directement Click-Capital.
TradingView ne recommande PAS de payer ou d'utiliser un script à moins que vous ne fassiez entièrement confiance à son auteur et que vous compreniez comment il fonctionne. Vous pouvez également trouver des alternatives gratuites et open-source dans nos scripts communautaires.
Instructions de l'auteur
Clause de non-responsabilité
Script sur invitation seulement
Seuls les utilisateurs approuvés par l'auteur peuvent accéder à ce script. Vous devrez demander et obtenir l'autorisation pour l'utiliser. Celle-ci est généralement accordée après paiement. Pour plus de détails, suivez les instructions de l'auteur ci-dessous ou contactez directement Click-Capital.
TradingView ne recommande PAS de payer ou d'utiliser un script à moins que vous ne fassiez entièrement confiance à son auteur et que vous compreniez comment il fonctionne. Vous pouvez également trouver des alternatives gratuites et open-source dans nos scripts communautaires.