PROTECTED SOURCE SCRIPT
Mis à jour Oster's Vola Sentiment (OVS)
Overview:
Oster's Vola Sentiment (OVS) is an indicator that reflects market sentiment dynamics based on volatility, employing Oster's Volatility Method for calculation. Inspired by traditional volatility analysis, this indicator provides a versatile tool for traders to interpret market sentiments and identify potential trading opportunities, including potential reversal points. By adjusting the period length in the settings, users can fine-tune OVS sensitivity to capture buy or sell signals, achieving different signal qualities.
Sophisticated Calculation Methodology:
The OVS derives insights from Oster's Volatility Method, utilizing metrics related to price range and movement to assess market dynamics. It calculates the relative movement index, providing traders with a quantifiable measure of market sentiment. Additionally, OVS incorporates the Average True Range (ATR) to further refine its analysis, ensuring comprehensive insights into market volatility dynamics.
Interpretation:
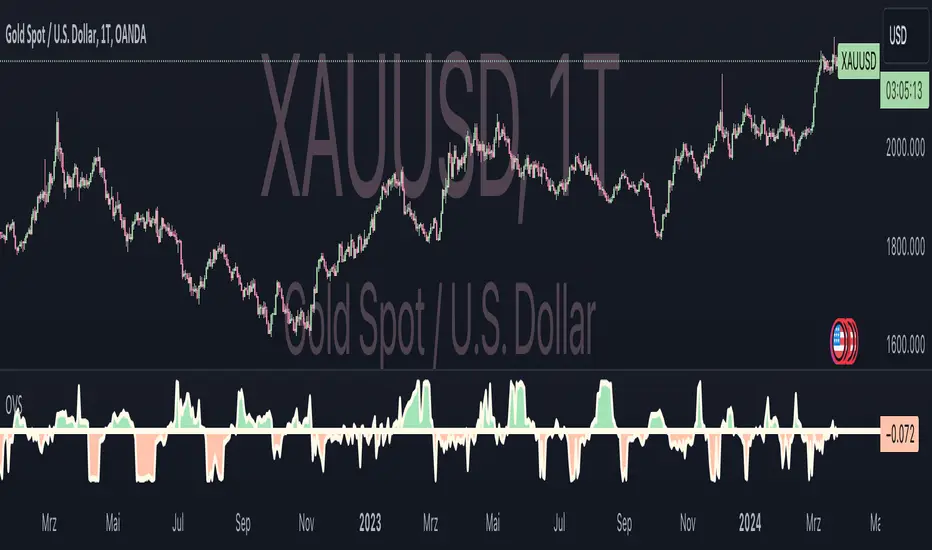
Oster's Vola Sentiment (OVS), represented on the chart, offers traders insights into market sentiment dynamics and potential reversal points. Values above 0 indicate a buy tendency, suggesting favorable conditions for buying opportunities, while values below 0 suggest a sell tendency, signaling potential selling pressure. The probability of a significant market move increases as OVS values approach the predefined buy or sell thresholds. Values exceeding the buy threshold indicate stronger buying signals, while values below the sell threshold signify stronger selling signals. By aligning these interpretations with the trader's investment strategy, OVS aids in decision-making processes, offering nuanced perspectives on market movements.
Dynamic Color Coding for Visual Clarity:
To enhance user experience and facilitate quick decision-making, OVS incorporates dynamic color coding. Market conditions favoring selling are denoted by red hues, while those conducive to buying are highlighted in green. Neutral conditions, indicative of balanced market sentiment, are represented in neutral colors. This intuitive visual feedback enables traders to swiftly identify market opportunities and risks, empowering them to make informed trading decisions.
Customizable Parameters for Tailored Analysis:
Acknowledging the diverse trading preferences and strategies of its users, OVS offers customizable parameters. Traders can adjust the period length to fine-tune the indicator's sensitivity to their desired level, balancing the frequency and quality of signals according to their trading objectives. Additionally, OVSs alert functionalities allow traders to set personalized thresholds, aligning with their risk tolerance and market outlook.
Conclusion:
In conclusion, Oster's Vola Sentiment (OVS) emerges as a valuable addition to the trader's toolkit, offering a versatile and accessible approach to market analysis. Built upon Oster's Volatility Method and sophisticated calculation methodologies, OVS provides traders with actionable insights into market sentiment across various timeframes and asset classes, including potential reversal points. Its intuitive visualizations, coupled with customizable parameters and alert functionalities, empower traders to navigate dynamic market conditions with confidence. Whether you're a seasoned investor or a novice trader, OVS equips you with the tools needed to stay ahead in today's competitive markets.
Oster's Vola Sentiment (OVS) is an indicator that reflects market sentiment dynamics based on volatility, employing Oster's Volatility Method for calculation. Inspired by traditional volatility analysis, this indicator provides a versatile tool for traders to interpret market sentiments and identify potential trading opportunities, including potential reversal points. By adjusting the period length in the settings, users can fine-tune OVS sensitivity to capture buy or sell signals, achieving different signal qualities.
Sophisticated Calculation Methodology:
The OVS derives insights from Oster's Volatility Method, utilizing metrics related to price range and movement to assess market dynamics. It calculates the relative movement index, providing traders with a quantifiable measure of market sentiment. Additionally, OVS incorporates the Average True Range (ATR) to further refine its analysis, ensuring comprehensive insights into market volatility dynamics.
Interpretation:
Oster's Vola Sentiment (OVS), represented on the chart, offers traders insights into market sentiment dynamics and potential reversal points. Values above 0 indicate a buy tendency, suggesting favorable conditions for buying opportunities, while values below 0 suggest a sell tendency, signaling potential selling pressure. The probability of a significant market move increases as OVS values approach the predefined buy or sell thresholds. Values exceeding the buy threshold indicate stronger buying signals, while values below the sell threshold signify stronger selling signals. By aligning these interpretations with the trader's investment strategy, OVS aids in decision-making processes, offering nuanced perspectives on market movements.
Dynamic Color Coding for Visual Clarity:
To enhance user experience and facilitate quick decision-making, OVS incorporates dynamic color coding. Market conditions favoring selling are denoted by red hues, while those conducive to buying are highlighted in green. Neutral conditions, indicative of balanced market sentiment, are represented in neutral colors. This intuitive visual feedback enables traders to swiftly identify market opportunities and risks, empowering them to make informed trading decisions.
Customizable Parameters for Tailored Analysis:
Acknowledging the diverse trading preferences and strategies of its users, OVS offers customizable parameters. Traders can adjust the period length to fine-tune the indicator's sensitivity to their desired level, balancing the frequency and quality of signals according to their trading objectives. Additionally, OVSs alert functionalities allow traders to set personalized thresholds, aligning with their risk tolerance and market outlook.
Conclusion:
In conclusion, Oster's Vola Sentiment (OVS) emerges as a valuable addition to the trader's toolkit, offering a versatile and accessible approach to market analysis. Built upon Oster's Volatility Method and sophisticated calculation methodologies, OVS provides traders with actionable insights into market sentiment across various timeframes and asset classes, including potential reversal points. Its intuitive visualizations, coupled with customizable parameters and alert functionalities, empower traders to navigate dynamic market conditions with confidence. Whether you're a seasoned investor or a novice trader, OVS equips you with the tools needed to stay ahead in today's competitive markets.
Notes de version
made a few small stylish adjustments: above all, light colors were replaced with dark ones, especially since most users use light mode and otherwise the indicator would not be easily recognizable in terms of color ...Script protégé
Ce script est publié en source fermée. Cependant, vous pouvez l'utiliser librement et sans aucune restriction – pour en savoir plus, cliquez ici.
Clause de non-responsabilité
Les informations et publications ne sont pas destinées à être, et ne constituent pas, des conseils ou recommandations financiers, d'investissement, de trading ou autres fournis ou approuvés par TradingView. Pour en savoir plus, consultez les Conditions d'utilisation.
Script protégé
Ce script est publié en source fermée. Cependant, vous pouvez l'utiliser librement et sans aucune restriction – pour en savoir plus, cliquez ici.
Clause de non-responsabilité
Les informations et publications ne sont pas destinées à être, et ne constituent pas, des conseils ou recommandations financiers, d'investissement, de trading ou autres fournis ou approuvés par TradingView. Pour en savoir plus, consultez les Conditions d'utilisation.