OPEN-SOURCE SCRIPT
Mis à jour Seasonality Table - Tabular Form
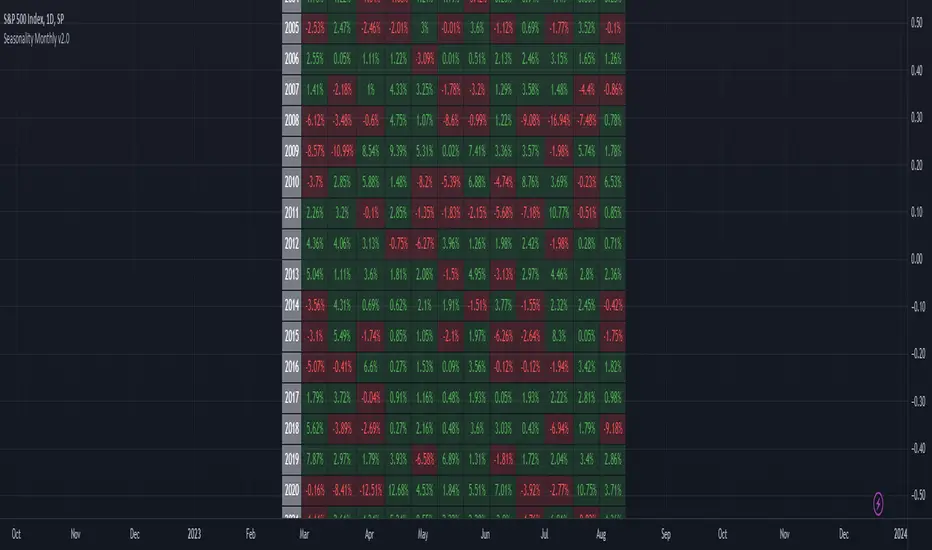
This indicator displays the seasonality data for any instrument (index/stock/futures/currency) in a tabular data.
User can change the start of the year for analysis from the inputs.
Year is represented in rows and Month is represented in cols.
This indicator uses Monthly Data feed to calculate the % change
Summary data for the month is displayed as the last row
User can change the start of the year for analysis from the inputs.
Year is represented in rows and Month is represented in cols.
This indicator uses Monthly Data feed to calculate the % change
Summary data for the month is displayed as the last row
Notes de version
Updated chartNotes de version
Switched to Daily feed from Monthly as Monthly feed is not reliable for US futures dataNotes de version
Added versioningNotes de version
- Added a new row at the bottom to show positive / total count
Notes de version
Fixed US Futures Sunday Open issueNotes de version
Switched calculation to Monthly close levels instead of accumulating % Daily Gains.Script open-source
Dans l'esprit TradingView, le créateur de ce script l'a rendu open source afin que les traders puissent examiner et vérifier ses fonctionnalités. Bravo à l'auteur! Bien que vous puissiez l'utiliser gratuitement, n'oubliez pas que la republication du code est soumise à nos Règles.
Clause de non-responsabilité
Les informations et publications ne sont pas destinées à être, et ne constituent pas, des conseils ou recommandations financiers, d'investissement, de trading ou autres fournis ou approuvés par TradingView. Pour en savoir plus, consultez les Conditions d'utilisation.
Script open-source
Dans l'esprit TradingView, le créateur de ce script l'a rendu open source afin que les traders puissent examiner et vérifier ses fonctionnalités. Bravo à l'auteur! Bien que vous puissiez l'utiliser gratuitement, n'oubliez pas que la republication du code est soumise à nos Règles.
Clause de non-responsabilité
Les informations et publications ne sont pas destinées à être, et ne constituent pas, des conseils ou recommandations financiers, d'investissement, de trading ou autres fournis ou approuvés par TradingView. Pour en savoir plus, consultez les Conditions d'utilisation.