PROTECTED SOURCE SCRIPT
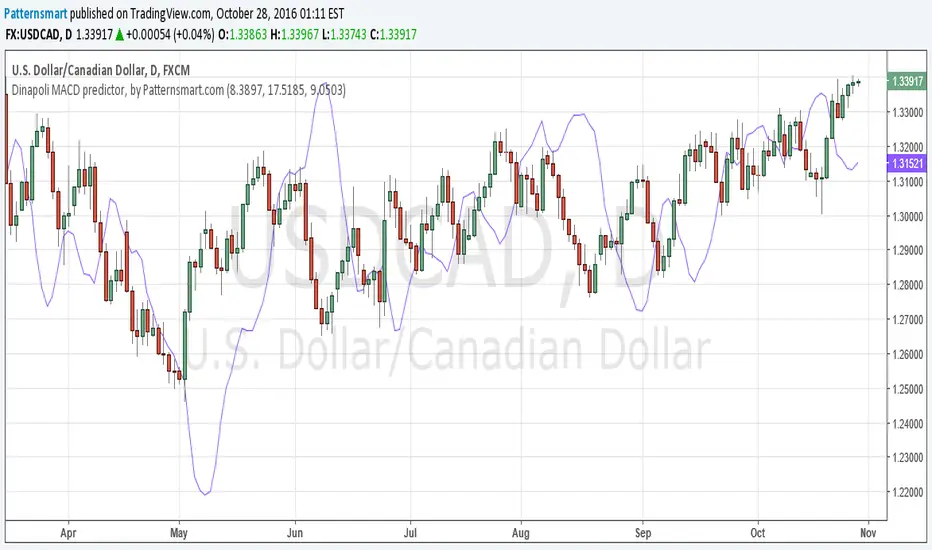
Dinapoli MACD predictor, by Patternsmart
// Technical Analysis & Research Patternsmart
// Custom indicators, Strategies, SCAN, Screener, Backtesting, Converting service for:
// Tradingview, NinjaTrader, Thinkorswim, MetaTrader, MetaStock, Multicharts, Prorealtime, etc.
Dinapoli macd predictor is a trending indicator that give you not only what direction a forex pair is moving but also how volatile the price is. When the Forex market starts giving new max or minimum level values, the Dinapoli macd predictor follows the price trend direction and pullsup the level of quit from the currency market. Stops should be applied where they are for a purpose, and in that case, should not be changed.
The whole idea behind a practical trading plan is to keep it as simple as possible.
There are two main advantages to its use.
1. You are able to determine, one period ahead of time, what price will cause the MACD to turn from a buy to a sell or visa versa. It is a cousin to the Oscillator predictor. If you take a position you know right then and there, the exact price, the current and next (future) bar will need to achieve for the MACD to cross. You can also literally see the distance the market has to go, before your current position is either helped or hindered by the force of the next MACD cross. You can do this in all time frames, as the predictor updates in real time.
2. You are able to determine the "Dynamic Pressure" on the market by clearly observing price action with the MACD Predictor history, superimposed directly on the bar chart. Dynamic pressure refers to how the market reacts to buy and sell signals. If you get a 30 minute sell on the MACD and the market goes flat for example, you know right then and there that the next buy signal is apt to be a big winner! This was something I would regularly do with the standard DiNapoli MACD but now it is so much easier to see!
Script protégé
Ce script est publié en source fermée. Cependant, vous pouvez l'utiliser librement et sans aucune restriction – pour en savoir plus, cliquez ici.
Clause de non-responsabilité
Les informations et publications ne sont pas destinées à être, et ne constituent pas, des conseils ou recommandations financiers, d'investissement, de trading ou autres fournis ou approuvés par TradingView. Pour en savoir plus, consultez les Conditions d'utilisation.