OPEN-SOURCE SCRIPT
PowerXYZ Strategy (PowerX Modified)
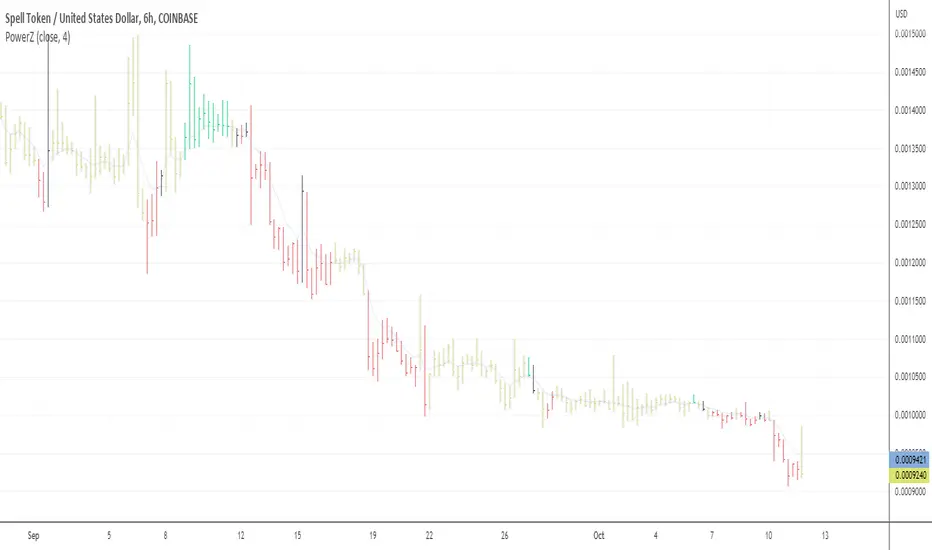
This script modifies the PowerX strategy in the following ways:
- there are two types of 'black' bars, yellow and black; the bars that are colored black indicate the flip of the RSI from positive to negative, and vise versa, while the signal is also near to green or red color; the close of these bars are a strong indication of support or resistance, and the previous closes behind these bars create S&D zones.
- compares the typical price to the 4-period smoothed moving average to generate yellow bars sooner at the end of trends.
- uses a signal line of > 49 and <= 49 instead of 50.
Yellow indicates that you should probably move your stop closer to the current price.
Black indicates that you should probably exit and look for a new entry, as it is a strong area of support or resistance.
Script open-source
Dans l'esprit TradingView, le créateur de ce script l'a rendu open source afin que les traders puissent examiner et vérifier ses fonctionnalités. Bravo à l'auteur! Bien que vous puissiez l'utiliser gratuitement, n'oubliez pas que la republication du code est soumise à nos Règles.
Clause de non-responsabilité
Les informations et publications ne sont pas destinées à être, et ne constituent pas, des conseils ou recommandations financiers, d'investissement, de trading ou autres fournis ou approuvés par TradingView. Pour en savoir plus, consultez les Conditions d'utilisation.