OPEN-SOURCE SCRIPT
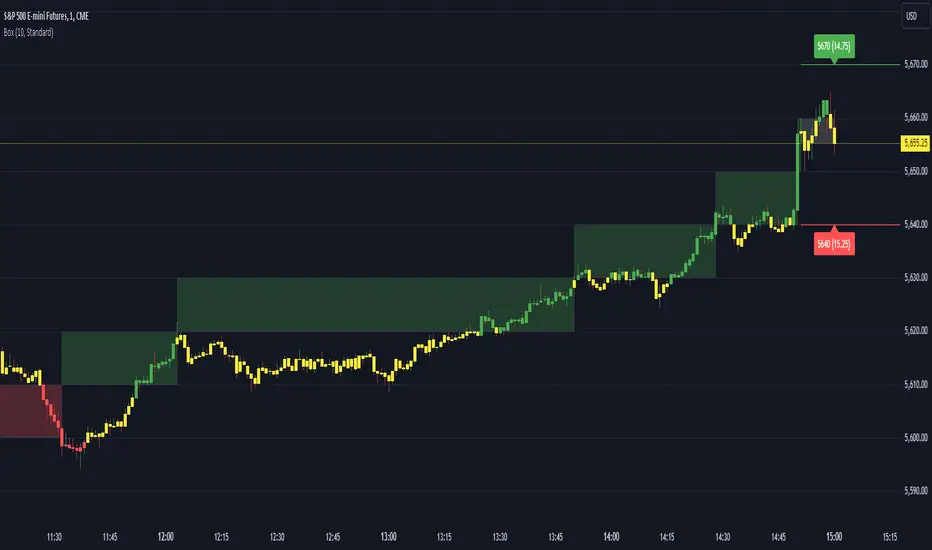
Mis à jour Renko Box Chart Overlay by BD

This is Renko chart overlay for Candles chart. You can use it to identify market direction and potential key points.
To use it simply select box size and any timeframe you want.
With this overlay you can be sure that you'll see every brick on a chart showing general market direction with all the details of a candles chart.
Alternatives Renko overlay charts:

If you don't have access to 1s timeframe or you don't want to use low TF here is the situation with built in Renko chart on 5m TF:

This Renko boxes are linked to chart by time(candle) and price. It will draw a box even if price didn't close above(or below) of box level:

But be careful when setting box size too small because it will produce bad results:

The issue is known and I'll work on fixing it in next update, for now use box size at least the size of a body of a candle, after all renko is for general market movement and not for marking up every tick.
Let me know if you want to see any additions.
To use it simply select box size and any timeframe you want.
With this overlay you can be sure that you'll see every brick on a chart showing general market direction with all the details of a candles chart.
Alternatives Renko overlay charts:
If you don't have access to 1s timeframe or you don't want to use low TF here is the situation with built in Renko chart on 5m TF:
This Renko boxes are linked to chart by time(candle) and price. It will draw a box even if price didn't close above(or below) of box level:
But be careful when setting box size too small because it will produce bad results:
The issue is known and I'll work on fixing it in next update, for now use box size at least the size of a body of a candle, after all renko is for general market movement and not for marking up every tick.
Let me know if you want to see any additions.
Notes de version
Good news, everyone! With this major update I'm offering you the most accurate Renko chart overlay on the market today. Now you can set any Box size on any TF you like and be sure that every brick will be plotted on a chart! *Limitations of chart resolution still apply*
Minor updates:
Added label text color setting
Added "Display Until" feature - use this if you can't see all boxes on a chart (because of max box limit)
Notes de version
*Updated screen pictureNotes de version
- Minor improvement
- Bug fix
- Added Alerts (on next box level)
Notes de version
- Minor productivity improvement
- Added Box border color input
Notes de version
Improvement:- Removed max bars back limitation when selected large box value and low TF
Notes de version
Update:- Added candles repainting based on closing price above/below/within Box's high/low.
- Added "Anchored" option. With this feature you can set start time and initial high/low of a box yourself.
https://www.tradingview.com/x/DtcGJkAH/
Notes de version
- Reworked "Anchored" option.
- Added "Reset Daily" option.
- Added options to set initial price.
- Added optional selection for labels.
- Added option to update labels (so they are always at the rightmost bar).
- Added Remainder calculation (to next box level).
- Added "Projected Box" option.
- Significantly improved performance.
Notes de version
Minor improvements.Notes de version
Performance improvements and fixesNotes de version
added Once Per Bar setting for alertsNotes de version
- performance improvement
Notes de version
- Fixed a bug when box wasn't drawn when current price was equal to next box level on symbols with price close to or below 1 (like EUR/USD). *The issue is due to the way Pinescript works.
- Fixed a bug when drawing too wide box on low TF (1s-5s TF).
Script open-source
Dans l'esprit TradingView, le créateur de ce script l'a rendu open source afin que les traders puissent examiner et vérifier ses fonctionnalités. Bravo à l'auteur! Bien que vous puissiez l'utiliser gratuitement, n'oubliez pas que la republication du code est soumise à nos Règles.
Clause de non-responsabilité
Les informations et publications ne sont pas destinées à être, et ne constituent pas, des conseils ou recommandations financiers, d'investissement, de trading ou autres fournis ou approuvés par TradingView. Pour en savoir plus, consultez les Conditions d'utilisation.