OPEN-SOURCE SCRIPT
EWMA Volatility Bands
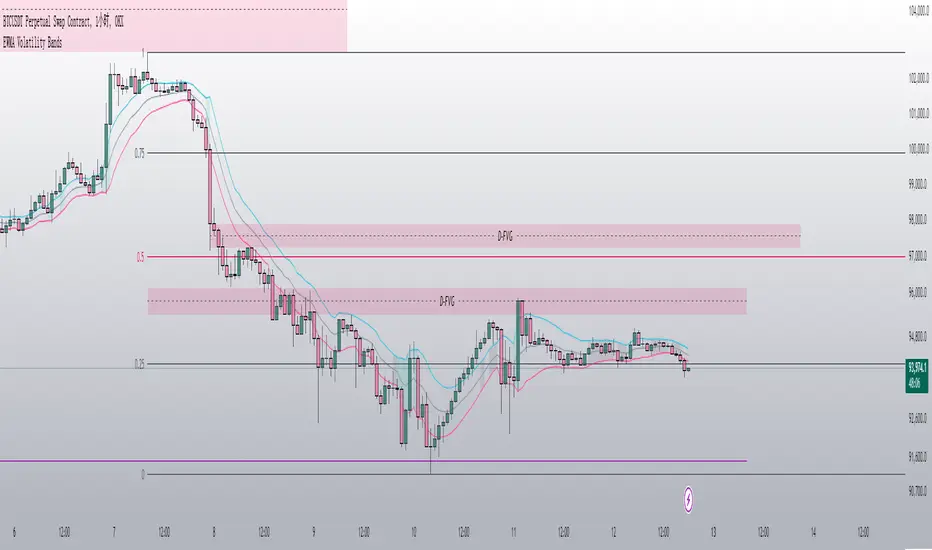
The EWMA Volatility Bands indicator combines an Exponential Moving Average (EMA) and Exponentially Weighted Moving Average (EWMA) of volatility to create dynamic upper and lower price bands. It helps traders identify trends, measure market volatility, and spot extreme conditions. Key features include:
Centerline (EMA): Tracks the trend based on a user-defined period.
Volatility Bands: Adjusted by the square root of volatility, representing potential price ranges.
Percentile Rank: Highlights extreme volatility (e.g., >99% or <1%) with shaded areas between the bands.
This tool is useful for trend-following, risk assessment, and identifying overbought/oversold conditions.
Script open-source
Dans l'esprit TradingView, le créateur de ce script l'a rendu open source afin que les traders puissent examiner et vérifier ses fonctionnalités. Bravo à l'auteur! Bien que vous puissiez l'utiliser gratuitement, n'oubliez pas que la republication du code est soumise à nos Règles.
Clause de non-responsabilité
Les informations et publications ne sont pas destinées à être, et ne constituent pas, des conseils ou recommandations financiers, d'investissement, de trading ou autres fournis ou approuvés par TradingView. Pour en savoir plus, consultez les Conditions d'utilisation.