OPEN-SOURCE SCRIPT
USDT.D + USDT.C ALL TIMEFRAMES
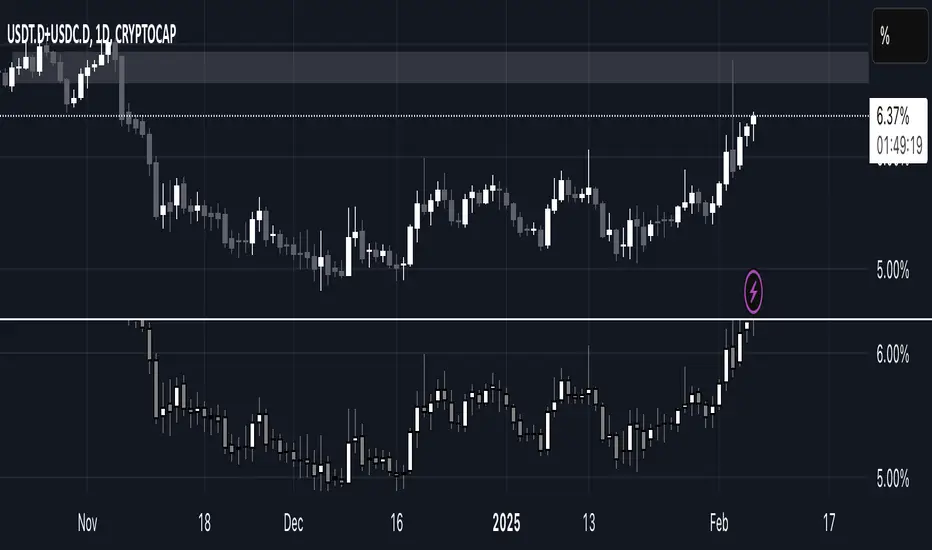
This indicator combines the dominance of USDT (USDT.D) and USDC (USDC.D) to track total stablecoin market share across all timeframes. It displays the combined dominance as candlesticks, providing a clearer view of market liquidity shifts and investor sentiment.
📌 How to Use:
Green candles indicate rising stablecoin dominance (potential risk-off sentiment).
Red candles indicate declining stablecoin dominance (potential risk-on sentiment).
Works on all timeframes, from intraday scalping to macro trend analysis.
This tool is essential for traders looking to analyze stablecoin liquidity flow, identify market turning points, and refine trading strategies based on stablecoin dominance behavior. 🚀
Script open-source
Dans l'esprit TradingView, le créateur de ce script l'a rendu open source afin que les traders puissent examiner et vérifier ses fonctionnalités. Bravo à l'auteur! Bien que vous puissiez l'utiliser gratuitement, n'oubliez pas que la republication du code est soumise à nos Règles.
Clause de non-responsabilité
Les informations et publications ne sont pas destinées à être, et ne constituent pas, des conseils ou recommandations financiers, d'investissement, de trading ou autres fournis ou approuvés par TradingView. Pour en savoir plus, consultez les Conditions d'utilisation.