OPEN-SOURCE SCRIPT
SMA Table with Alerts and Intersections
🌟 **Presenting the Dynamic SMA Intersection Alert Indicator!** 🌟
### **Overview:**
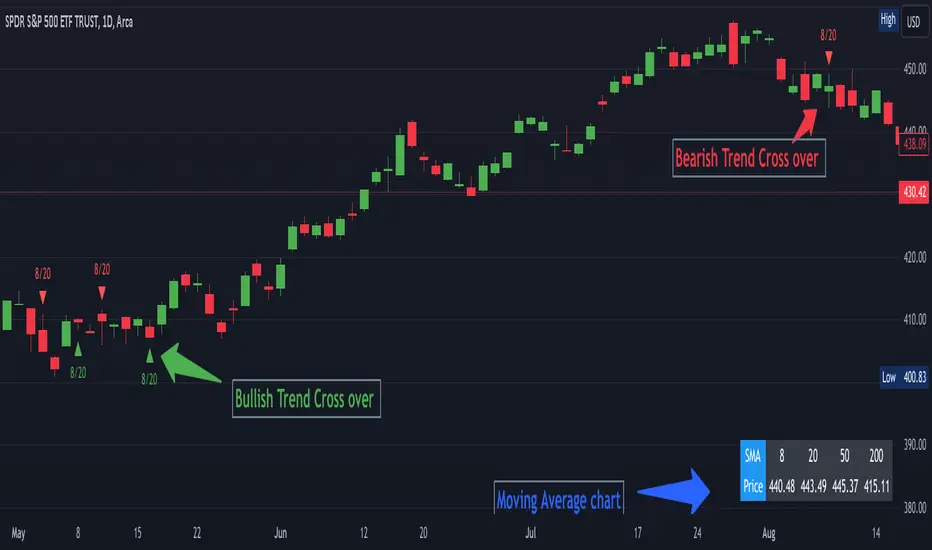
The Dynamic SMA Intersection Alert Indicator is a sophisticated tool developed for traders seeking simplicity and effectiveness. It integrates multiple Simple Moving Averages (SMA) to deliver real-time alerts and visual cues, enabling traders to identify potential market entry points with ease.
### **Features:**
1. **Multi-SMA Visualization:**
- Incorporates four SMAs: 8, 20, 50, 200 periods.
- Displays a customizable table showing the current value of each SMA.
2. **Alerts in Real-Time:**
- Provides instant notifications for price crossings over any of the SMAs.
- Offers customizable alert messages.
3. **Visualization of Intersection Points:**
- Displays green triangles for bullish crosses and red for bearish, directly on the chart.
- Allows for the identification of precise intersection points between shorter-term and longer-term SMAs.
### **Benefits:**
- **Informed Decision-Making:** Enables quick discernment of market trends.
- **Efficiency:** Automates the tracking of SMA intersections.
- **User-Friendly:** Applicable for both novice and experienced traders.
### **How It Operates:**
- The indicator computes four different SMAs and presents their current values systematically.
- It triggers a real-time alert when the price crosses any SMA, instantly notifying the trader.
- Visual cues are plotted on the chart when any two SMAs intersect, indicating the type of cross.
### **Enhance Your Trading Experience!**
The Dynamic SMA Intersection Alert Indicator is designed to refine your trading experience and assist in making informed and timely trading decisions. Leverage this tool to stay abreast of market trends and enhance your market understanding!
### **Overview:**
The Dynamic SMA Intersection Alert Indicator is a sophisticated tool developed for traders seeking simplicity and effectiveness. It integrates multiple Simple Moving Averages (SMA) to deliver real-time alerts and visual cues, enabling traders to identify potential market entry points with ease.
### **Features:**
1. **Multi-SMA Visualization:**
- Incorporates four SMAs: 8, 20, 50, 200 periods.
- Displays a customizable table showing the current value of each SMA.
2. **Alerts in Real-Time:**
- Provides instant notifications for price crossings over any of the SMAs.
- Offers customizable alert messages.
3. **Visualization of Intersection Points:**
- Displays green triangles for bullish crosses and red for bearish, directly on the chart.
- Allows for the identification of precise intersection points between shorter-term and longer-term SMAs.
### **Benefits:**
- **Informed Decision-Making:** Enables quick discernment of market trends.
- **Efficiency:** Automates the tracking of SMA intersections.
- **User-Friendly:** Applicable for both novice and experienced traders.
### **How It Operates:**
- The indicator computes four different SMAs and presents their current values systematically.
- It triggers a real-time alert when the price crosses any SMA, instantly notifying the trader.
- Visual cues are plotted on the chart when any two SMAs intersect, indicating the type of cross.
### **Enhance Your Trading Experience!**
The Dynamic SMA Intersection Alert Indicator is designed to refine your trading experience and assist in making informed and timely trading decisions. Leverage this tool to stay abreast of market trends and enhance your market understanding!
Script open-source
Dans l'esprit TradingView, le créateur de ce script l'a rendu open source afin que les traders puissent examiner et vérifier ses fonctionnalités. Bravo à l'auteur! Bien que vous puissiez l'utiliser gratuitement, n'oubliez pas que la republication du code est soumise à nos Règles.
Trade smarter not harder!
Clause de non-responsabilité
Les informations et publications ne sont pas destinées à être, et ne constituent pas, des conseils ou recommandations financiers, d'investissement, de trading ou autres fournis ou approuvés par TradingView. Pour en savoir plus, consultez les Conditions d'utilisation.