PROTECTED SOURCE SCRIPT
Flow
Hello, everyone,
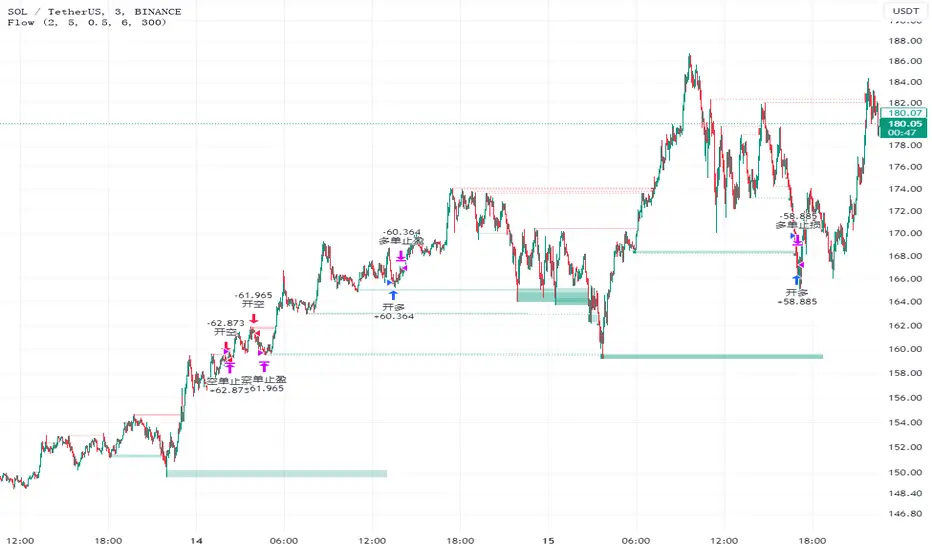
Recently I found a useful indicator for the short-term minute-level trading called Liquidity Sweeps. This is a technical indicator that studies the resistance and support levels of candle patterns.
The strategy takes into account the following market factors:
Lql -> resistance formed by a rapid rise or support formed by a rapid rise
Sweep Area -> potential entry point
The inspiration of this strategy comes mostly from Liquidity Sweeps (LuxAlgo), but I have also optimized it based on my own trading experience.
What are the differences from the original strategy?
The Only Outbreaks & Retest option has been removed, and the formation of Wicks is enough to prevent conflicting signals.
The P&L ratio of the strategy has been set, which allows more combinations of the appropriate strategy parameters to match different characteristics of trading pairs.
Signals
1. Enter the trade when three consecutive bars are formed in the Wicks block (resistance or support) and set the stop-loss/stop-profit
2. The condition is not met when three bars are formed in the Wicks block, and the Wicks index is reset when the price returns.
Risk Management
1. Use the P&L ratio, plus appropriate ATR volatility to prevent false breakouts.
2. When the signal is reversed.
3. The strategy is suitable for the short-term level, not for the trend market.
Now, for the inexperienced reader, a series of knowledge. ATR: Like Boolean channel and ADX, Average True Rage is an indicator used to measure price volatility. But unlike these two indicators, it can reflect the price volatility more accurately because of the factors such as gaps added in its calculation process. For this reason, it is called "true" volatility.
Sincerely,
Special thanks to LuxAlgo for sharing.
Script protégé
Ce script est publié en source fermée. Cependant, vous pouvez l'utiliser librement et sans aucune restriction – pour en savoir plus, cliquez ici.
Clause de non-responsabilité
Les informations et publications ne sont pas destinées à être, et ne constituent pas, des conseils ou recommandations financiers, d'investissement, de trading ou autres fournis ou approuvés par TradingView. Pour en savoir plus, consultez les Conditions d'utilisation.