OPEN-SOURCE SCRIPT
Custom SMA Plot
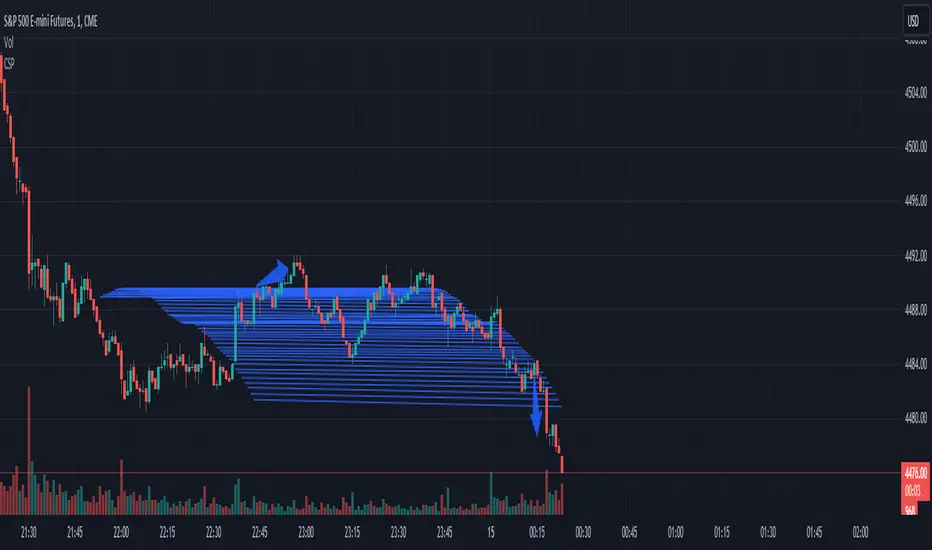
It creates a custom indicator named "Custom SMA Plot (CSP)" that overlays on a price chart. The indicator fetches the closing prices and calculates a 14-period simple moving average (SMA) of these prices. This SMA is then visually represented as a blue line, which starts from the SMA value of the bar 100 candles ago and extends to the current bar's SMA value. The line has a thickness of 1 unit.
When price breaks over wave go long.
When price breaks below wave go short.
When price breaks over wave go long.
When price breaks below wave go short.
Script open-source
Dans l'esprit TradingView, le créateur de ce script l'a rendu open source afin que les traders puissent examiner et vérifier ses fonctionnalités. Bravo à l'auteur! Bien que vous puissiez l'utiliser gratuitement, n'oubliez pas que la republication du code est soumise à nos Règles.
Clause de non-responsabilité
Les informations et publications ne sont pas destinées à être, et ne constituent pas, des conseils ou recommandations financiers, d'investissement, de trading ou autres fournis ou approuvés par TradingView. Pour en savoir plus, consultez les Conditions d'utilisation.