OPEN-SOURCE SCRIPT
Mis à jour Shifted EMA
Shifted EMA Indicator for TradingView
The Shifted EMA indicator is a customized technical analysis tool designed for TradingView's Pine Script version 5. This indicator plots the Exponential Moving Average (EMA) of a specified length along with its upper and lower shifted counterparts. The shifts allow traders to visualize price movements relative to dynamically adjusted EMA levels, potentially aiding in identifying overbought or oversold conditions, support and resistance zones, or trend confirmations.
Key Features:
Exponential Moving Average (EMA):
Calculates and plots the EMA based on the user-defined period (EMA Length). The EMA gives more weight to recent price data, making it more responsive to recent price changes compared to the Simple Moving Average (SMA).
Upper and Lower Shifts:
Allows users to define vertical shifts (Upper Shift and Lower Shift) to the EMA, plotting two additional lines above and below the standard EMA. These shifted lines can serve as dynamic support and resistance levels or zones of interest.
Customizable Parameters:
EMA Length: Defines the period over which the EMA is calculated. A longer period smoothens the EMA, while a shorter period makes it more sensitive to recent price changes.
Upper Shift: Determines the number of points to shift the EMA upwards.
Lower Shift: Determines the number of points to shift the EMA downwards.
Visual Aids:
Distinct colors and line widths are used for each plotted line to enhance clarity:
EMA: Blue line
Upper Shifted EMA: Red line
Lower Shifted EMA: Green line
How to Use:
Adding the Indicator:
Apply the Shifted EMA indicator to your desired chart in TradingView.
Configuring Parameters:
Adjust the EMA Length to set the period for the EMA calculation based on your trading strategy or preference.
Set the Upper Shift and Lower Shift values to determine how far above and below the EMA the shifted lines should be plotted. It's advisable to start with smaller shift values to ensure the shifted lines remain within a relevant range of the price action.
Interpreting the Indicator:
Trend Analysis: The standard EMA can help identify the prevailing market trend. Prices consistently above the EMA may indicate an uptrend, while prices below suggest a downtrend.
Dynamic Support and Resistance: The upper and lower shifted EMAs can act as dynamic resistance and support levels, respectively. Price reactions at these levels might provide trading signals or areas of interest.
Overbought/Oversold Conditions: Significant deviations of the price from the shifted EMAs might hint at overbought or oversold conditions, potentially signaling reversals or pullbacks.
Note: Like all technical indicators, the Shifted EMA should not be used in isolation. It's recommended to combine it with other analysis tools, indicators, or fundamental analysis to make well-informed trading decisions. Always ensure to test and validate the indicator's effectiveness within your specific trading strategy and risk management framework.
Notes de version
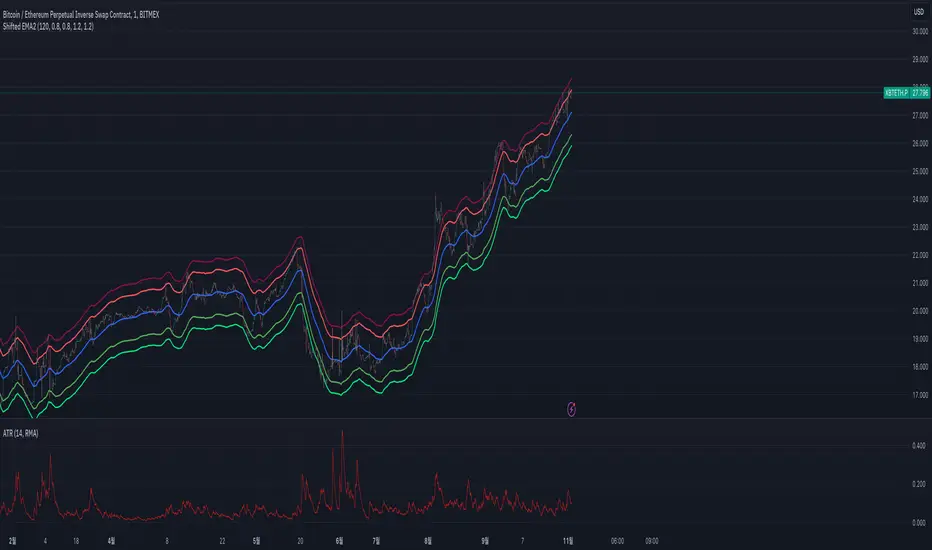
Shifted EMA Indicator for TradingViewThe Shifted EMA indicator is a customized technical analysis tool designed for TradingView's Pine Script version 5. This indicator plots the Exponential Moving Average (EMA) of a specified length along with its upper and lower shifted counterparts. The shifts allow traders to visualize price movements relative to dynamically adjusted EMA levels, potentially aiding in identifying overbought or oversold conditions, support and resistance zones, or trend confirmations.
Key Features:
Exponential Moving Average (EMA):
Calculates and plots the EMA based on the user-defined period (EMA Length). The EMA gives more weight to recent price data, making it more responsive to recent price changes compared to the Simple Moving Average (SMA).
Upper and Lower Shifts:
Allows users to define vertical shifts (Upper Shift and Lower Shift) to the EMA, plotting two additional lines above and below the standard EMA. These shifted lines can serve as dynamic support and resistance levels or zones of interest.
Customizable Parameters:
EMA Length: Defines the period over which the EMA is calculated. A longer period smoothens the EMA, while a shorter period makes it more sensitive to recent price changes.
Upper Shift: Determines the number of points to shift the EMA upwards.
Lower Shift: Determines the number of points to shift the EMA downwards.
Visual Aids:
Distinct colors and line widths are used for each plotted line to enhance clarity:
EMA: Blue line
Upper1 Shifted EMA: Red line
Lower1 Shifted EMA: Green line
Upper2 Shifted EMA: Maroon line
Lower2 Shifted EMA: Lime line
How to Use:
Adding the Indicator:
Apply the Shifted EMA indicator to your desired chart in TradingView.
Configuring Parameters:
Adjust the EMA Length to set the period for the EMA calculation based on your trading strategy or preference.
Set the Upper Shift and Lower Shift values to determine how far above and below the EMA the shifted lines should be plotted. It's advisable to start with smaller shift values to ensure the shifted lines remain within a relevant range of the price action.
Interpreting the Indicator:
Trend Analysis: The standard EMA can help identify the prevailing market trend. Prices consistently above the EMA may indicate an uptrend, while prices below suggest a downtrend.
Dynamic Support and Resistance: The upper and lower shifted EMAs can act as dynamic resistance and support levels, respectively. Price reactions at these levels might provide trading signals or areas of interest.
Overbought/Oversold Conditions: Significant deviations of the price from the shifted EMAs might hint at overbought or oversold conditions, potentially signaling reversals or pullbacks.
Note: Like all technical indicators, the Shifted EMA should not be used in isolation. It's recommended to combine it with other analysis tools, indicators, or fundamental analysis to make well-informed trading decisions. Always ensure to test and validate the indicator's effectiveness within your specific trading strategy and risk management framework.
Script open-source
Dans l'esprit TradingView, le créateur de ce script l'a rendu open source afin que les traders puissent examiner et vérifier ses fonctionnalités. Bravo à l'auteur! Bien que vous puissiez l'utiliser gratuitement, n'oubliez pas que la republication du code est soumise à nos Règles.
Clause de non-responsabilité
Les informations et publications ne sont pas destinées à être, et ne constituent pas, des conseils ou recommandations financiers, d'investissement, de trading ou autres fournis ou approuvés par TradingView. Pour en savoir plus, consultez les Conditions d'utilisation.