PROTECTED SOURCE SCRIPT
NUPL
NUPL
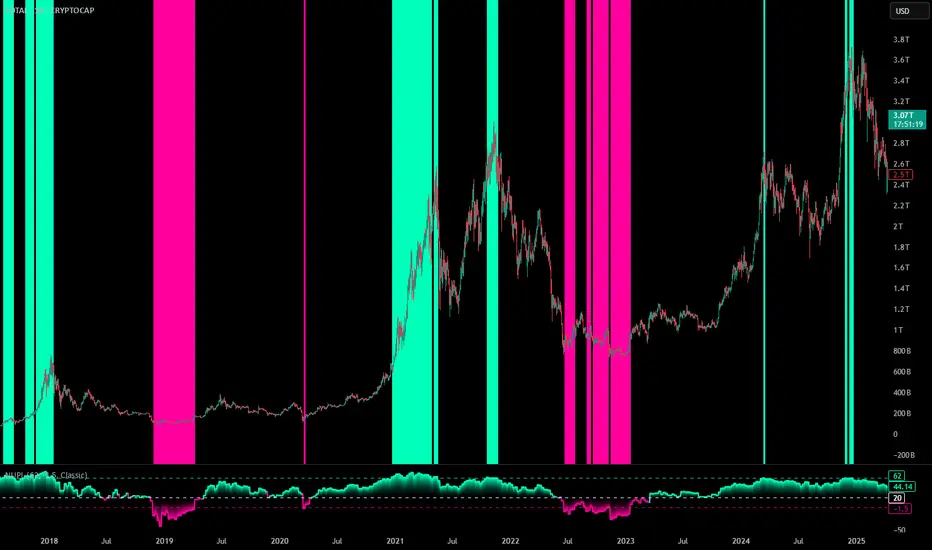
The Net Unrealized Profit and Loss (NUPL) is an advanced on-chain indicator that is measured by subtracting the Realized Value from Market Value. Realized Value takes the price of each Bitcoin when it was last moved. It adds up all individual prices and takes an average. It multiplies that average price by the total number of coins in circulation. Market Value is the current price of Bitcoin multiplied by the number of coins in circulation. This gives us the NUPL which estimates the total paper profits/losses in Bitcoin held by investors.
Features
This script offers several customizable inputs, enabling traders to tailor the indicator to their preferences. Traders can also adjust the thresholds to define the sensitivity of overbought and oversold conditions.
It has 10 available color schemes to choose from and the background coloring on the chart can be toggled on and off.
Practical Applications
This indicator is designed for traders who focus on identifying cycle extremes and potential mean reversion opportunities.
Detecting Overbought and Oversold Conditions: The indicator measures how far the price has deviated from its norm, allowing traders to identify overbought or oversold conditions with precision.
Timing Market Reversals: The indicator provides early signals of potential market reversals by highlighting when the price has moved too far away from its average, helping traders anticipate reversion opportunities.
Script protégé
Ce script est publié en source fermée. Cependant, vous pouvez l'utiliser librement et sans aucune restriction – pour en savoir plus, cliquez ici.
Clause de non-responsabilité
Les informations et publications ne sont pas destinées à être, et ne constituent pas, des conseils ou recommandations financiers, d'investissement, de trading ou autres fournis ou approuvés par TradingView. Pour en savoir plus, consultez les Conditions d'utilisation.