OPEN-SOURCE SCRIPT
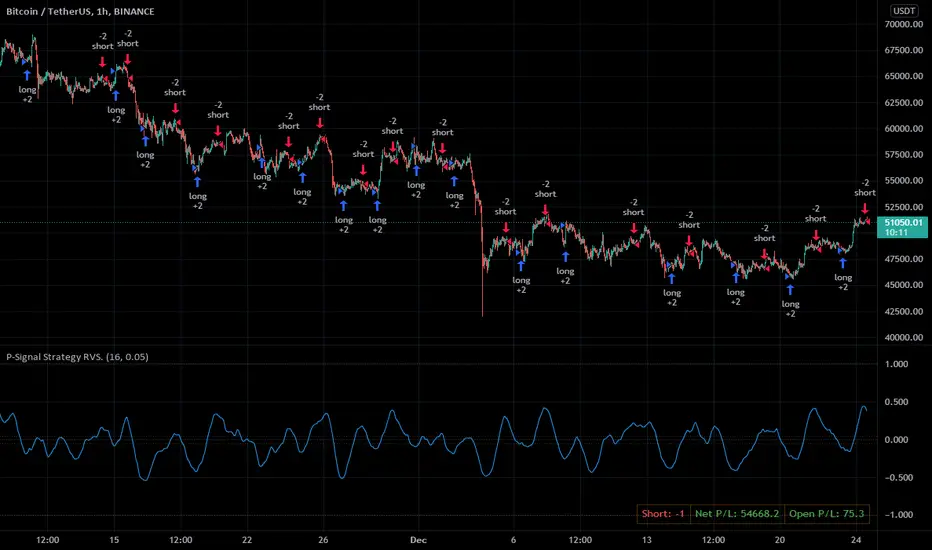
P-Signal Strategy RVS.
For Christmas and New Year,
for P-Signal users - the PINE code of a reverse (trigger) strategy!
Strategy parameters.
==================
1. Cardinality – the number of points (from 4 to 200) that make up a set of elementary events (bar). This is the main parameter that determines success.
2. |ΔErf| - a size of the Δ region (from 0 to 1) of the error integral near zero. Helps save on commissions.
3. Observation time – the deputy speaks for himself.
NB: In the strategy, process_orders_on_close = true, order executes after a bar closes and strategy calculations are completed. Also Barstate.isconfirmed, i.e. the script is calculating the last (closing) update of the current bar.
Usage advice.
============
Set your exchange commission (0.2% by default). Start your search by increasing the parameter Cardinality. If in the Performance Summary two parameters Net Profit and Commission Paid are of the same sign and order, you are in luck, you have found a suitable probabilistic space. Further, you can reduce the losses from the commission using the parameter |ΔErf|.
Do not forget to publish the idea, for example: P-Signal Strategy RVS: BTCUSDT 1h (16, 0.05).
Note.
=====
P-signal is theoretical. It works in a probabilistic space endowed with energy (entropy).
Script open-source
Dans l'esprit TradingView, le créateur de ce script l'a rendu open source afin que les traders puissent examiner et vérifier ses fonctionnalités. Bravo à l'auteur! Bien que vous puissiez l'utiliser gratuitement, n'oubliez pas que la republication du code est soumise à nos Règles.
Clause de non-responsabilité
Les informations et publications ne sont pas destinées à être, et ne constituent pas, des conseils ou recommandations financiers, d'investissement, de trading ou autres fournis ou approuvés par TradingView. Pour en savoir plus, consultez les Conditions d'utilisation.