OPEN-SOURCE SCRIPT
Option Pair Zigzag
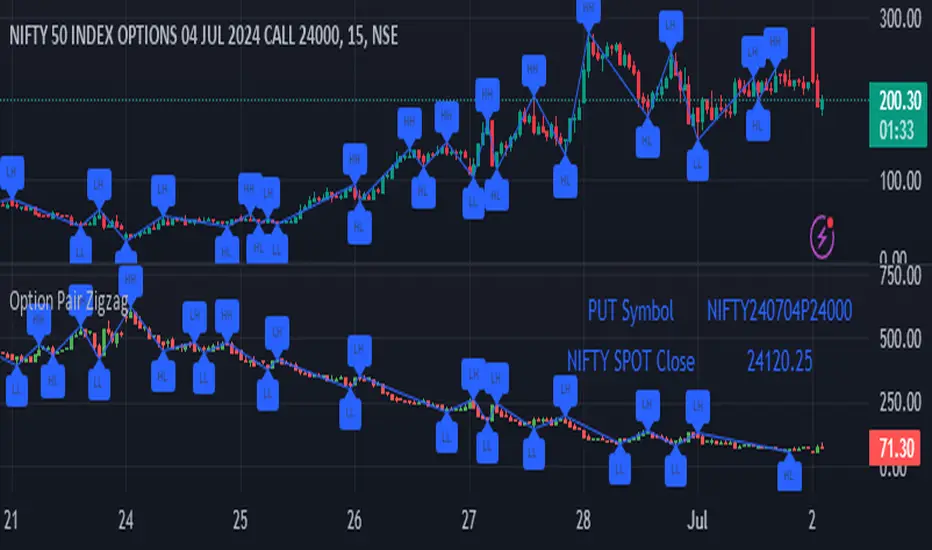
Options Pair Zigzag:
Though we can split the chart window and view multiple charts, this indicator is useful when we view options charts.
How this indicator works:
The indicator works in non-overlay mode.
The indicator will find other option pair symbol and load it’s chart in indicator window. It will also draw a zigzag on both the charts. It will also fetch the SPOT symbol and display SPOT Close price of latest candle.
Useful information:
A. Support resistance: Higher High (HH) and Lower Low (LL) markings can be treated as strong support and or resistance and LH, HL markings can be treated as weak support and or resistance.
B. Trend identification: Easy identification of trend based on trend lines and trend markings i.e. Higher High (HH), Lower Low (LL), Lower High (LH), Higher Low (HL)
C. Use of Rate of change (ROC )– Labels drawn on swing points are equipped with ROC% between swing points. ROC% between Call and Put option charts can be compared and used to identify strong and weak moves.
Example:
1. User loads a call option chart of ‘NIFTY240620C23500’ (NIFTY 50 INDEX OPTIONS 20 JUN 2024 CALL 23500)
2. Since user has selected CALL Option, Indicator rules/logic will find PUT Option symbol of same strike and expiry
3. PUT Option chart would then shown in the indicator window
4. Draw zigzag on both the charts
5. Plot labels on both the charts
6. Labels are equipped with a tooltip showing rate of change between 2 pivot points
Input Parameters:
Left bars – Parameter required for plotting zigzag
Right bars – Parameter required for plotting zigzag
Plot HHLL Labels – Enable/disable plotting of labels
Use cases:
Refer to chart snapshots:
1. Buy Call Option or Sell Put Option - How one can trade on formation of a consolidation range
2. Breakdown of Swing structure - One can observe Swing structure (Zigzag) formed on a SPOT chart and trade on break of swing structure
3. Triangle formation - Observe the patterns formed on the SPOT chart and trade either Call or Put options. Example snapshot shows trade based on triangle pattern
Chart Snapshot:


One can split chart window and load base symbol chart which will help to review bases symbol and options chart at the same time.
Buy Call Option or Sell Put Option

Breakdown of Swing structure

Triangle formation

Though we can split the chart window and view multiple charts, this indicator is useful when we view options charts.
How this indicator works:
The indicator works in non-overlay mode.
The indicator will find other option pair symbol and load it’s chart in indicator window. It will also draw a zigzag on both the charts. It will also fetch the SPOT symbol and display SPOT Close price of latest candle.
Useful information:
A. Support resistance: Higher High (HH) and Lower Low (LL) markings can be treated as strong support and or resistance and LH, HL markings can be treated as weak support and or resistance.
B. Trend identification: Easy identification of trend based on trend lines and trend markings i.e. Higher High (HH), Lower Low (LL), Lower High (LH), Higher Low (HL)
C. Use of Rate of change (ROC )– Labels drawn on swing points are equipped with ROC% between swing points. ROC% between Call and Put option charts can be compared and used to identify strong and weak moves.
Example:
1. User loads a call option chart of ‘NIFTY240620C23500’ (NIFTY 50 INDEX OPTIONS 20 JUN 2024 CALL 23500)
2. Since user has selected CALL Option, Indicator rules/logic will find PUT Option symbol of same strike and expiry
3. PUT Option chart would then shown in the indicator window
4. Draw zigzag on both the charts
5. Plot labels on both the charts
6. Labels are equipped with a tooltip showing rate of change between 2 pivot points
Input Parameters:
Left bars – Parameter required for plotting zigzag
Right bars – Parameter required for plotting zigzag
Plot HHLL Labels – Enable/disable plotting of labels
Use cases:
Refer to chart snapshots:
1. Buy Call Option or Sell Put Option - How one can trade on formation of a consolidation range
2. Breakdown of Swing structure - One can observe Swing structure (Zigzag) formed on a SPOT chart and trade on break of swing structure
3. Triangle formation - Observe the patterns formed on the SPOT chart and trade either Call or Put options. Example snapshot shows trade based on triangle pattern
Chart Snapshot:
One can split chart window and load base symbol chart which will help to review bases symbol and options chart at the same time.
Buy Call Option or Sell Put Option
Breakdown of Swing structure
Triangle formation
Script open-source
Dans l'esprit TradingView, le créateur de ce script l'a rendu open source afin que les traders puissent examiner et vérifier ses fonctionnalités. Bravo à l'auteur! Bien que vous puissiez l'utiliser gratuitement, n'oubliez pas que la republication du code est soumise à nos Règles.
Clause de non-responsabilité
Les informations et publications ne sont pas destinées à être, et ne constituent pas, des conseils ou recommandations financiers, d'investissement, de trading ou autres fournis ou approuvés par TradingView. Pour en savoir plus, consultez les Conditions d'utilisation.