PROTECTED SOURCE SCRIPT
Moonrush

Moonrush Indicator - Multi-Timeframe Trend Analysis Tool
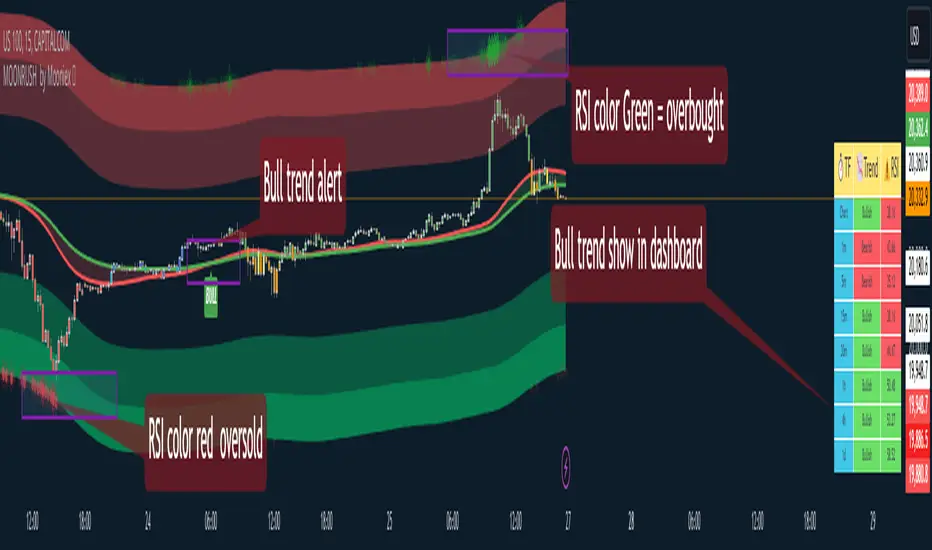
Moonrush is a trend analysis tool that helps traders see market trends and identify potential entry or exit points using a combination of Exponential Moving Averages (EMAs) and overbought/oversold signals. The tool has the ability to display data in an easy-to-read dashboard, eliminating the need for users to frequently change charts to get an overview of trends across multiple timeframes.
Key Features and Methods
Multi-Timeframe Trend Analysis:
Moonrush analyzes trends on 1-minute, 5-minute, 15-minute, 30-minute, 1-hour, 4-hour, and 1-day timeframes. It calculates the trend by comparing two user-defined EMA values (EMAfast and EMAslow). If the EMAfast crosses above the EMAslow, it indicates an uptrend (shown in green), while if it crosses below, it indicates a downtrend (shown in red). This allows traders to see the consistency of trends across multiple timeframes.
Customizable Dashboard:
Moonrush provides a dashboard that shows the trend and RSI index for each timeframe, with a table that allows traders to quickly assess market conditions. By displaying the RSI level, it can indicate overbought or oversold conditions. Green is used to indicate overbought conditions, while red is used for oversold conditions.
Overbought/Oversold Color Display:
The dashboard highlights overbought and oversold zones on the support EMA and resistance EMA lines, making it easier for users to identify reversal opportunities.
Key Parameters for Flexibility
EMA Adjustment and Toggle Switch:
Users can adjust the EMAfast and EMAslow parameters to suit their preferences, including turning the EMA display on or off as needed.
Dashboard Customization:
Traders can adjust the size and position of the dashboard to enhance usability, ensuring a clear display without cluttering the chart.
Focus on Risk Management:
Although Moonrush helps in trend detection, users should use this analysis in conjunction with appropriate risk management techniques. It is important to understand how Moonrush works, as the intersection of the EMA and RSI can help identify reversal and continuation patterns. However, users should consider the limitations of this indicator and examine the signals within a broader trading strategy.
How to Use Moonrush
Trend Confirmation:
Check the dashboard to see if trends across multiple timeframes are consistent, to create opportunities to follow or counter the trend.
Identifying Reversals:
Use the overbought and oversold color representations on the EMA support/resistance lines as reversal signals.
Customization:
Adjust the EMA values to your trading style and turn the display on or off as needed.
Moonrush, which combines EMA crossovers and RSI indicators, offers a versatile approach to trend analysis across multiple timeframes. However, traders should note that no single indicator can guarantee success. Users should conduct thorough backtesting and use it in accordance with their personal trading goals and risk tolerance.
##Please note that the tool (Moonrush) is not a guarantee of future market performance and should be used in conjunction with appropriate risk management. Users should ensure that they fully understand the methodology and limitations of the indicator before making any investment decisions. In addition, past performance is not an indication of future results.
Script protégé
Ce script est publié en source fermée. Cependant, vous pouvez l'utiliser librement et sans aucune restriction – pour en savoir plus, cliquez ici.
Clause de non-responsabilité
Les informations et publications ne sont pas destinées à être, et ne constituent pas, des conseils ou recommandations financiers, d'investissement, de trading ou autres fournis ou approuvés par TradingView. Pour en savoir plus, consultez les Conditions d'utilisation.