OPEN-SOURCE SCRIPT
William's ProGo indicator
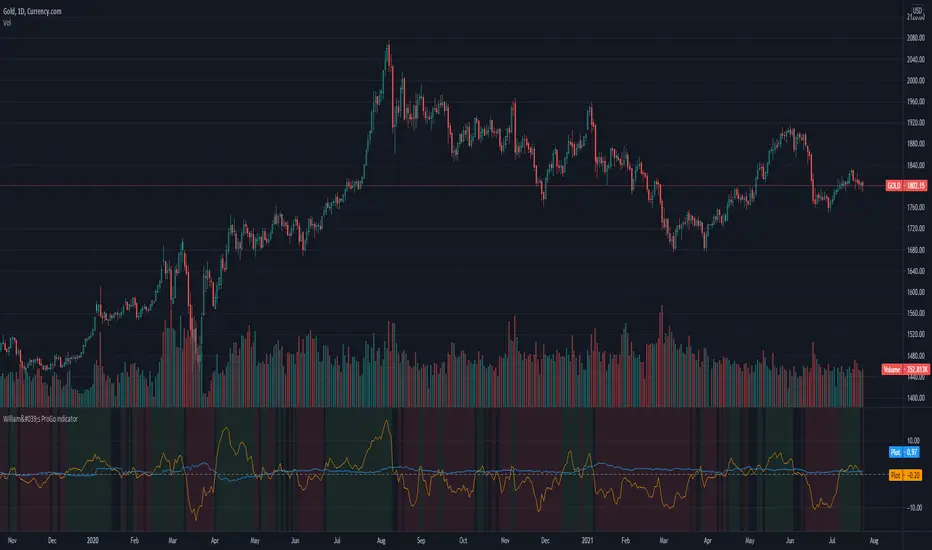
ProGo, created by Larry William, (earlier than 2002), is a 2 line graph using daily data.
1. Professional Line (color orange) is a professional Accumulation/Distribution line is constructed by using the change from today's open to today's close.
2. The Public Line (color blue) is done by creating a public accumulation/distribution line that shows the change from yesterdays close to today's open.
The graph is an index of the previous close to open +/- values (public) and then taking a 14 day average which is plotted against a 14 day average of the +/- values of the open to close(pro).
Background color:
Green colored area is where "pro" line crossover "amatuers" line, and the "pro" line is also positive.
Created this for literature review.
Script open-source
Dans l'esprit TradingView, le créateur de ce script l'a rendu open source afin que les traders puissent examiner et vérifier ses fonctionnalités. Bravo à l'auteur! Bien que vous puissiez l'utiliser gratuitement, n'oubliez pas que la republication du code est soumise à nos Règles.
Clause de non-responsabilité
Les informations et publications ne sont pas destinées à être, et ne constituent pas, des conseils ou recommandations financiers, d'investissement, de trading ou autres fournis ou approuvés par TradingView. Pour en savoir plus, consultez les Conditions d'utilisation.