OPEN-SOURCE SCRIPT
Mis à jour Price Change History
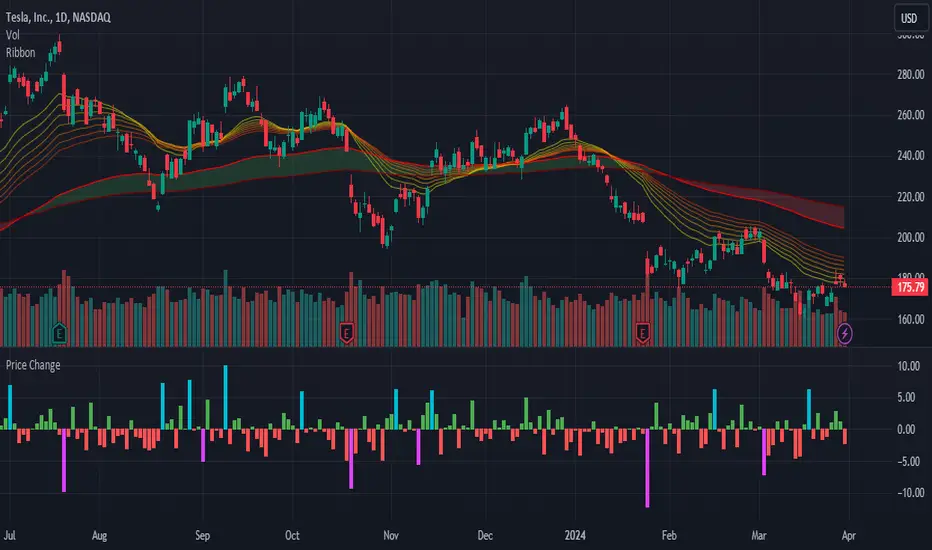
Display a histogram of price changes over a given interval. Show change as a percentage or in dollar amount. Highlight changes that exceed a particular value.
Notes de version
By default, the histogram shows price change since the previous bar. This update allows you to display price change since any number of bars ago.Notes de version
Separate high and low highlighting.Notes de version
Update study shorttitle.Notes de version
The ratio of highlighted to unhighlighted bars is now shown as the orange number ranging from 0 to 1.It takes into consideration the previous 50 bars by default, but can be changed by the user under settings.
Notes de version
- Updated the names of a few settings to be clearer as to what they do.- Included some documentation in the source code to explain each setting.
Notes de version
- Add default precision
- Improve comments
Notes de version
Updated to Pine Script v4Notes de version
- Update to Pine Script v5- Additional comments
- Code cleanup
Script open-source
Dans l'esprit TradingView, le créateur de ce script l'a rendu open source afin que les traders puissent examiner et vérifier ses fonctionnalités. Bravo à l'auteur! Bien que vous puissiez l'utiliser gratuitement, n'oubliez pas que la republication du code est soumise à nos Règles.
Clause de non-responsabilité
Les informations et publications ne sont pas destinées à être, et ne constituent pas, des conseils ou recommandations financiers, d'investissement, de trading ou autres fournis ou approuvés par TradingView. Pour en savoir plus, consultez les Conditions d'utilisation.