OPEN-SOURCE SCRIPT
Inside Bar + Harami Combo
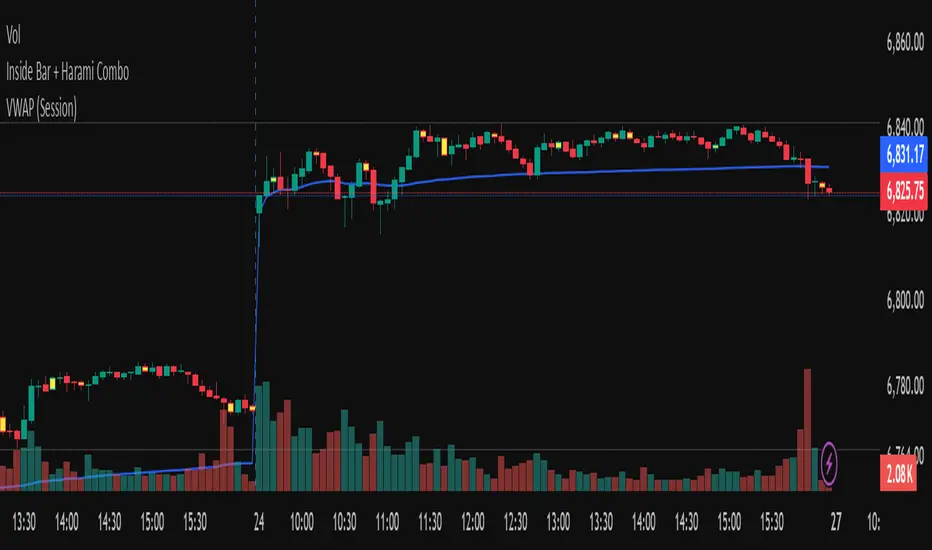
This indicator visually highlights Inside Bars, Outside Bars, and Harami candlestick patterns directly on your chart using clean color-coded candles — no labels, no shapes, just visual clarity.
It helps traders quickly identify potential reversal and continuation setups by coloring candles according to the detected pattern type.
🔍 Patterns Detected
🟨 Inside Bar — Current candle’s range is completely inside the previous candle’s range.
Often signals price contraction before a breakout.
💗 Outside Bar — Current candle’s high and low exceed the previous candle’s range.
Indicates volatility expansion and possible trend continuation.
🟩 Bullish Harami — A small bullish candle within the body of a prior bearish candle.
Suggests potential reversal to the upside.
🟥 Bearish Harami — A small bearish candle within the body of a prior bullish candle.
Suggests potential reversal to the downside.
⚙️ Features
Customizable colors for each pattern type.
Simple overlay visualization — no shapes, no labels, just colored candles.
Harami colors automatically override Inside/Outside colors when both occur on the same bar.
Lightweight logic for smooth performance on any timeframe or symbol.
💡 How to Use
Apply the indicator to your chart.
Configure colors in the settings panel if desired.
Watch for highlighted candles:
Inside Bars often precede breakouts.
Harami patterns can mark reversal zones.
Combine with trend tools (like moving averages) to confirm setups.
⚠️ Note
This indicator is for visual pattern detection and educational use only.
Always combine candlestick signals with broader technical or market context before trading decisions.
Script open-source
Dans l'esprit TradingView, le créateur de ce script l'a rendu open source afin que les traders puissent examiner et vérifier ses fonctionnalités. Bravo à l'auteur! Bien que vous puissiez l'utiliser gratuitement, n'oubliez pas que la republication du code est soumise à nos Règles.
Clause de non-responsabilité
Les informations et publications ne sont pas destinées à être, et ne constituent pas, des conseils ou recommandations financiers, d'investissement, de trading ou autres fournis ou approuvés par TradingView. Pour en savoir plus, consultez les Conditions d'utilisation.