OPEN-SOURCE SCRIPT
Regression Line (OLS) w/Residual Bands - Beasley Savage
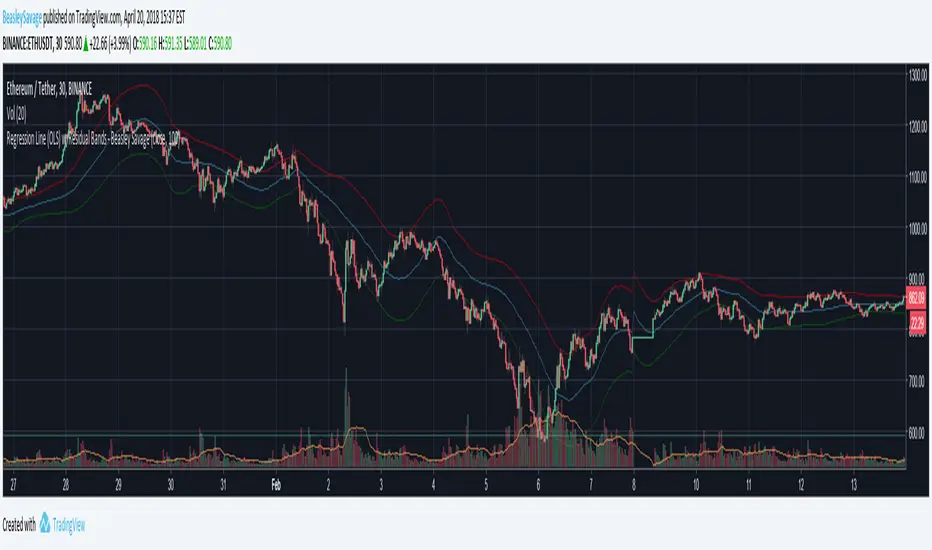
Plots linear regression "line of best fit" for a given source and length. Also plots the standard deviation of residuals as upper and lower bands. For some reason it's not plotting the lines exactly where the values are, so I wouldn't recommend using it as a purely visual indicator, but it could be used in strategies. A quick implementation of a strategy buying when the close crossed over the lower band and selling when close crossed under the upper band resulted in ~60-70% trade accuracy, not taking into account commission/slippage.
If anyone knows how to fix the lines not plotting accurately please let me know :)
If anyone knows how to fix the lines not plotting accurately please let me know :)
Script open-source
Dans l'esprit TradingView, le créateur de ce script l'a rendu open source afin que les traders puissent examiner et vérifier ses fonctionnalités. Bravo à l'auteur! Bien que vous puissiez l'utiliser gratuitement, n'oubliez pas que la republication du code est soumise à nos Règles.
Clause de non-responsabilité
Les informations et publications ne sont pas destinées à être, et ne constituent pas, des conseils ou recommandations financiers, d'investissement, de trading ou autres fournis ou approuvés par TradingView. Pour en savoir plus, consultez les Conditions d'utilisation.