PROTECTED SOURCE SCRIPT
Mis à jour IndiAlls
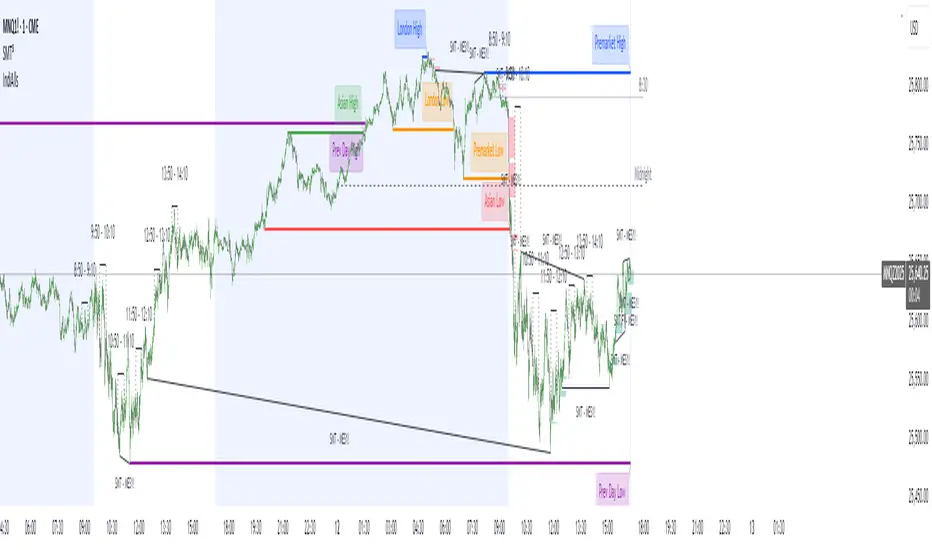
IndiAlls is a versatile overlay indicator designed for traders analyzing market structure, sessions, and key level. It combines several popular tools into one script, including session highs/lows, fair value gaps (FVG), macro time trackers, RSI dashboards, displacement detection, engulfing candles, and various line drawings (e.g., midnight opens, vertical lines). This indicator is intended for educational and analytical purposes, helping users visualize potential support/resistance levels, gaps, and momentum across timeframes.
Key Features
How to Use
This indicator is overlay-based and does not plot traditional series but uses lines, boxes, labels, and tables for visualization.
Input Settings
Key Features
- Session Highs/Lows: Tracks and draws lines for Asian and London sessions, previous day/week, and pre-market highs/lows. Lines extend until mitigated by price, with optional labels.
- Midnight and 8:30 Open Lines: Plots customizable lines at midnight and 8:30 AM (America/New_York time) with styles (solid, dotted, dashed) and history options.
- Fair Value Gaps (FVG): Detects bullish/bearish gaps based on a threshold percentage, draws extendable boxes, and removes them when filled (mitigated).
- Macro Time Tracker: Highlights specific 20-minute "macro" windows (e.g., 8:50-9:10 AM) with lines and labels, optimized for 15-minute charts, including Friday adjustments.
- Vertical Lines: Draws time-based vertical lines (e.g., every 15/30/60 minutes) within user-defined hours.
- RSI Dashboard: A table displaying RSI values across multiple timeframes (1m, 2m, 3m, 5m, 15m, 1h) with color-coded overbought/oversold highlights.
- Displacement Detection: Colors bars where candle range exceeds a standard deviation threshold, optionally requiring an FVG.
- Engulfing Candles: Highlights bullish/bearish engulfing patterns based on size and body ratios.
How to Use
- Add the indicator to your chart (works best on intraday timeframes like 1m-15m for stocks/futures).
- Adjust inputs in the settings panel to enable/disable features and customize colors, widths, and thresholds.
- Interpret visuals:
- Lines and boxes indicate potential key levels or gaps—watch for price interactions (e.g., bounces or breaks).
- Bar colors highlight displacement or engulfing patterns for momentum insights.
- The RSI table provides multi-timeframe overbought/oversold context. - Combine with other tools (e.g., volume, moving averages) for comprehensive analysis. Test on historical data to understand behavior.
This indicator is overlay-based and does not plot traditional series but uses lines, boxes, labels, and tables for visualization.
Input Settings
- Session High/Low Settings: Toggle Asian/London/Prev Day/Week displays, colors, widths, and label sizes.
- Midnight/True Day Open and 8:30 Open: Enable lines, styles (solid/dotted/dashed), colors, and history.
- Pre-Market Data High/Low: Toggle pre-market (7-9 AM) highs/lows, colors, widths, and labels.
- Macro Time: Enable specific macro windows (e.g., 8:50-9:10) with text options.
- Fair Value Gap Settings: Toggle FVG, threshold %, extend length, colors, and timeframe.
Vertical Lines Settings: Toggle lines, timeframe (15m/30m/1h), style, color, and hour range. - RSI Dashboard Settings: Toggle dashboard, position, size, transparency, and overbought/oversold levels.
- Displacement Settings: Toggle detection, require FVG, type (open-close/high-low), strength, and color.
- Engulfing Candle Settings: Toggle highlighting, bar ratio threshold, body/tail ratio, and color.
Notes de version
Updated sessions labels to avoid overlapping, label styles will automatically switch styles when session data are the same Notes de version
Updated Asia Time zone for Session LabelingNotes de version
Updated vertical lines, able to choose options m15, m30, 1 hourNotes de version
Updated Midnight and 8:30 Open to keep extending with the chartNotes de version
Updated Midnight and 830 label style, also updated option to adjust distance of 8:30 and midnight line from the current priceNotes de version
Added alert for Previous Day Low/High and Previous Week Low/High. Also update Label Style for Midnight and 8:30Script protégé
Ce script est publié en source fermée. Cependant, vous pouvez l'utiliser librement et sans aucune restriction – pour en savoir plus, cliquez ici.
Clause de non-responsabilité
Les informations et publications ne sont pas destinées à être, et ne constituent pas, des conseils ou recommandations financiers, d'investissement, de trading ou autres fournis ou approuvés par TradingView. Pour en savoir plus, consultez les Conditions d'utilisation.
Script protégé
Ce script est publié en source fermée. Cependant, vous pouvez l'utiliser librement et sans aucune restriction – pour en savoir plus, cliquez ici.
Clause de non-responsabilité
Les informations et publications ne sont pas destinées à être, et ne constituent pas, des conseils ou recommandations financiers, d'investissement, de trading ou autres fournis ou approuvés par TradingView. Pour en savoir plus, consultez les Conditions d'utilisation.