OPEN-SOURCE SCRIPT
Mis à jour Heatmapped Bollinger Bands
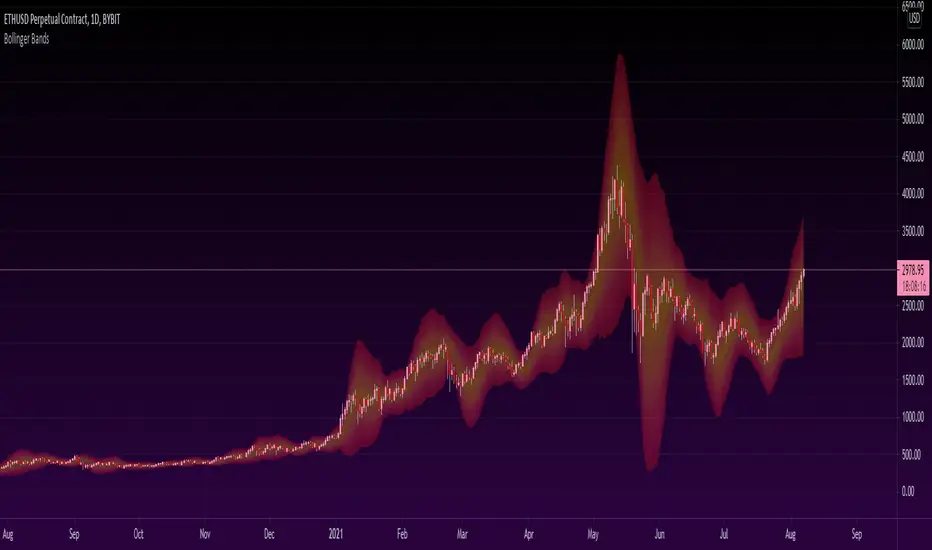
Bollinger Bands have been used for many years to determine the volatility and potential reversal area of markets. This script takes standard Bollinger Bands (BB) and transforms it into a heatmap of reversal areas.
A basic explanation on how this indicator works is:
- Yellow is where the price likes to stay,
- Orange is where the price might begin to reverse in a weak trend, and
- Red is where the price will either pause to let the yellow range catch up, or where the price will jump back down into the yellow range to stabilize.
For educational purposes: this script is essentially just taking the standard method of creating Bollinger Bands (seen in the 'Main Lines' portion of the script), coloring the plots 'na' so that they aren't seen, and using the 'fill' function to plot the yellow to red rainbow up to the top. I believe I made the yellow range 0.2*stdev to 1*stdev, the orange range 1*stdev to 2*stdev, and the red range 2*stdev to 3*stdev. You can get the hex code rainbow from any website that has a color slider.
** Disclaimer: THIS IS NOT TRADING ADVICE. Bollinger Bands should be used in conjunction with other indicators to make better decisions but NO STRATEGY IS PERFECT. Always backtest any strategy before using it live. **
Notes de version
Incorrect copyright username in script after username change. Corrected to @OztheWoz.Script open-source
Dans l'esprit TradingView, le créateur de ce script l'a rendu open source afin que les traders puissent examiner et vérifier ses fonctionnalités. Bravo à l'auteur! Bien que vous puissiez l'utiliser gratuitement, n'oubliez pas que la republication du code est soumise à nos Règles.
Clause de non-responsabilité
Les informations et publications ne sont pas destinées à être, et ne constituent pas, des conseils ou recommandations financiers, d'investissement, de trading ou autres fournis ou approuvés par TradingView. Pour en savoir plus, consultez les Conditions d'utilisation.
Script open-source
Dans l'esprit TradingView, le créateur de ce script l'a rendu open source afin que les traders puissent examiner et vérifier ses fonctionnalités. Bravo à l'auteur! Bien que vous puissiez l'utiliser gratuitement, n'oubliez pas que la republication du code est soumise à nos Règles.
Clause de non-responsabilité
Les informations et publications ne sont pas destinées à être, et ne constituent pas, des conseils ou recommandations financiers, d'investissement, de trading ou autres fournis ou approuvés par TradingView. Pour en savoir plus, consultez les Conditions d'utilisation.