OPEN-SOURCE SCRIPT
Trend/with EMA382
Introduction to the "Trend/with EMA382" Indicator
The "Trend/with EMA382" indicator is a powerful technical analysis tool that combines trend signals with Exponential Moving Averages (EMA), offering traders a comprehensive view of market dynamics and helping identify potential trading opportunities.
1. Trend Analysis with Trend
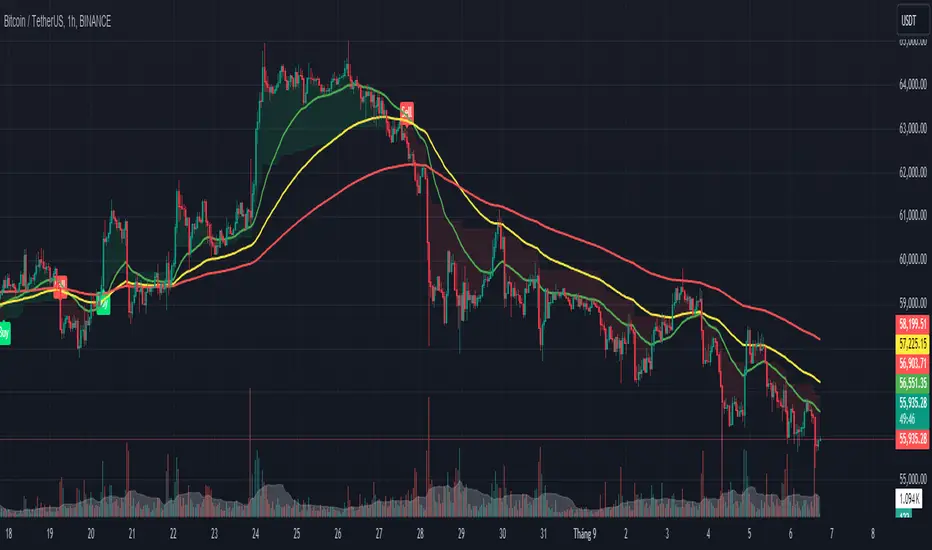
The first part of this indicator uses a trend calculation algorithm based on the recent market highs and lows. These levels are used to determine the primary trend:
Bullish (Uptrend): When the market is in an uptrend, the chart will display buy signals in green.
Bearish (Downtrend): When the market is trending down, sell signals are shown in red.
The crossover points between price and trend levels will indicate buy or sell signals on the chart, enabling traders to easily spot entry and exit points.
2. Combination with EMA382
EMA (Exponential Moving Average) is a crucial tool in technical analysis, helping smooth price data and eliminate insignificant short-term fluctuations. This indicator uses three key EMAs:
EMA 34: Reflects short-term trends.
EMA 89: Helps identify medium-term trends.
EMA 200: Determines long-term trends.
These three EMAs assist traders in identifying the overall direction of the market, allowing them to forecast potential trend developments.
3. Application in Trading
The "Trend/with EMA382" indicator is designed to suit various time frames, from short-term to long-term trading. The combination of trend signals and EMAs helps:
Identify the primary market trend.
Provide accurate entry and exit signals.
Deliver clear signals for risk management and profit optimization.
Conclusion
"Trend/with EMA382" is an effective indicator that offers clear signals for both trend and market momentum. By combining EMAs with trend analysis, this indicator empowers traders to make more informed and precise trading decisions.
The "Trend/with EMA382" indicator is a powerful technical analysis tool that combines trend signals with Exponential Moving Averages (EMA), offering traders a comprehensive view of market dynamics and helping identify potential trading opportunities.
1. Trend Analysis with Trend
The first part of this indicator uses a trend calculation algorithm based on the recent market highs and lows. These levels are used to determine the primary trend:
Bullish (Uptrend): When the market is in an uptrend, the chart will display buy signals in green.
Bearish (Downtrend): When the market is trending down, sell signals are shown in red.
The crossover points between price and trend levels will indicate buy or sell signals on the chart, enabling traders to easily spot entry and exit points.
2. Combination with EMA382
EMA (Exponential Moving Average) is a crucial tool in technical analysis, helping smooth price data and eliminate insignificant short-term fluctuations. This indicator uses three key EMAs:
EMA 34: Reflects short-term trends.
EMA 89: Helps identify medium-term trends.
EMA 200: Determines long-term trends.
These three EMAs assist traders in identifying the overall direction of the market, allowing them to forecast potential trend developments.
3. Application in Trading
The "Trend/with EMA382" indicator is designed to suit various time frames, from short-term to long-term trading. The combination of trend signals and EMAs helps:
Identify the primary market trend.
Provide accurate entry and exit signals.
Deliver clear signals for risk management and profit optimization.
Conclusion
"Trend/with EMA382" is an effective indicator that offers clear signals for both trend and market momentum. By combining EMAs with trend analysis, this indicator empowers traders to make more informed and precise trading decisions.
Script open-source
Dans l'esprit TradingView, le créateur de ce script l'a rendu open source afin que les traders puissent examiner et vérifier ses fonctionnalités. Bravo à l'auteur! Bien que vous puissiez l'utiliser gratuitement, n'oubliez pas que la republication du code est soumise à nos Règles.
Clause de non-responsabilité
Les informations et publications ne sont pas destinées à être, et ne constituent pas, des conseils ou recommandations financiers, d'investissement, de trading ou autres fournis ou approuvés par TradingView. Pour en savoir plus, consultez les Conditions d'utilisation.