OPEN-SOURCE SCRIPT
Mis à jour Turbulence with direction

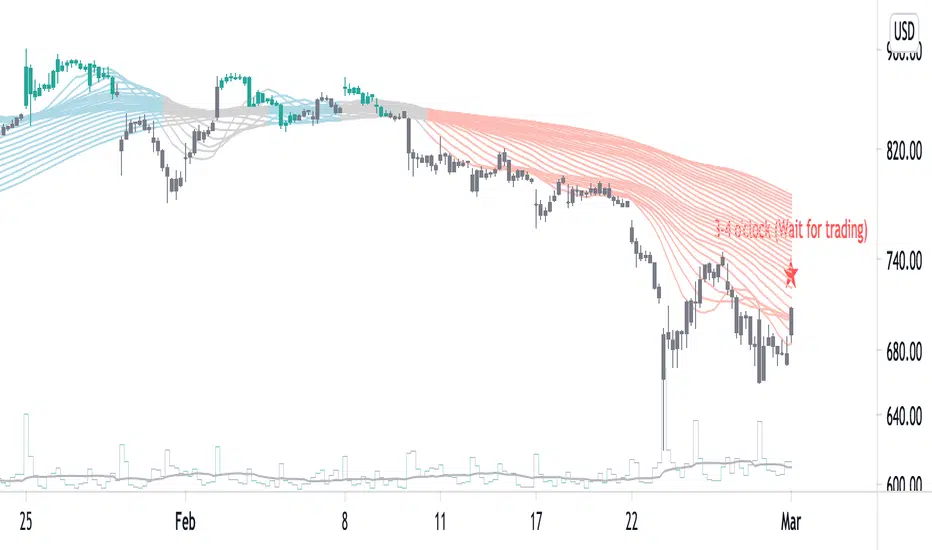
This indicator uses 28 SMA lines from SMA12 to SMA120 with an interval of 4 to reveal the unseen underlying structure that determines the stock price trend. The convergent area of MA lines usually creates support for the stock price. This indicator also includes a clock position for a clear view of the direction of the current trend.
This work is inspired by LoneCapical, Benoit Mandelbrot, and Bill Williams.
MA lines are colored with blue for bullish trends, red for bearish trends, and gray for no apparent direction.
This work is inspired by LoneCapical, Benoit Mandelbrot, and Bill Williams.
MA lines are colored with blue for bullish trends, red for bearish trends, and gray for no apparent direction.
Notes de version
This version calculates the slope with the logarithmic price difference and the logarithmic time interval, which provides a more accurate scale on the trend direction.Notes de version
Add an input option to turn the trading indication ON or OFF.Notes de version
Set the default option to not showing direction.Notes de version
Remove typos.Script open-source
Dans l'esprit TradingView, le créateur de ce script l'a rendu open source afin que les traders puissent examiner et vérifier ses fonctionnalités. Bravo à l'auteur! Bien que vous puissiez l'utiliser gratuitement, n'oubliez pas que la republication du code est soumise à nos Règles.
Clause de non-responsabilité
Les informations et publications ne sont pas destinées à être, et ne constituent pas, des conseils ou recommandations financiers, d'investissement, de trading ou autres fournis ou approuvés par TradingView. Pour en savoir plus, consultez les Conditions d'utilisation.
Script open-source
Dans l'esprit TradingView, le créateur de ce script l'a rendu open source afin que les traders puissent examiner et vérifier ses fonctionnalités. Bravo à l'auteur! Bien que vous puissiez l'utiliser gratuitement, n'oubliez pas que la republication du code est soumise à nos Règles.
Clause de non-responsabilité
Les informations et publications ne sont pas destinées à être, et ne constituent pas, des conseils ou recommandations financiers, d'investissement, de trading ou autres fournis ou approuvés par TradingView. Pour en savoir plus, consultez les Conditions d'utilisation.